Since mid-September, Bitcoin has been “crabbing” or sideways between $18,100 and $20,500.
The remarkably flat price action prompted statements like BTC is dead and Forex trading is the new crypto trading.
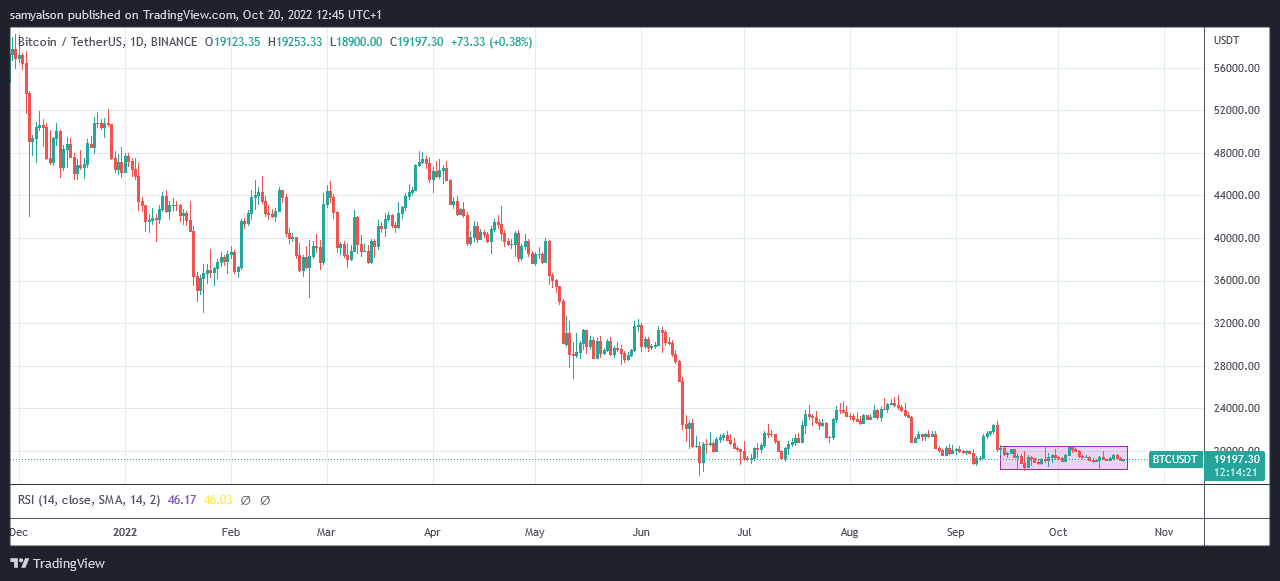
However, given the deteriorating macroeconomic environment, another way to look at it is that Bitcoin volatility has eased during these trying times.
Moreover, this is what Wall Street picked up.
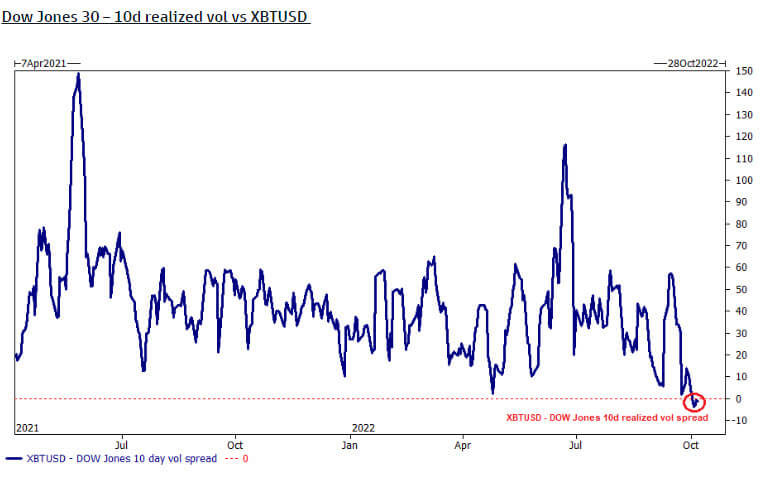
Dow Jones Volatility
The chart below shows the 10-day spread of realized volatility among the top 30 industrial stocks against Bitcoin.
Since October, BTC has remained relatively flat in dollar terms, so the metric is below zero, indicating that the Dow Jones is more volatile than Bitcoin.
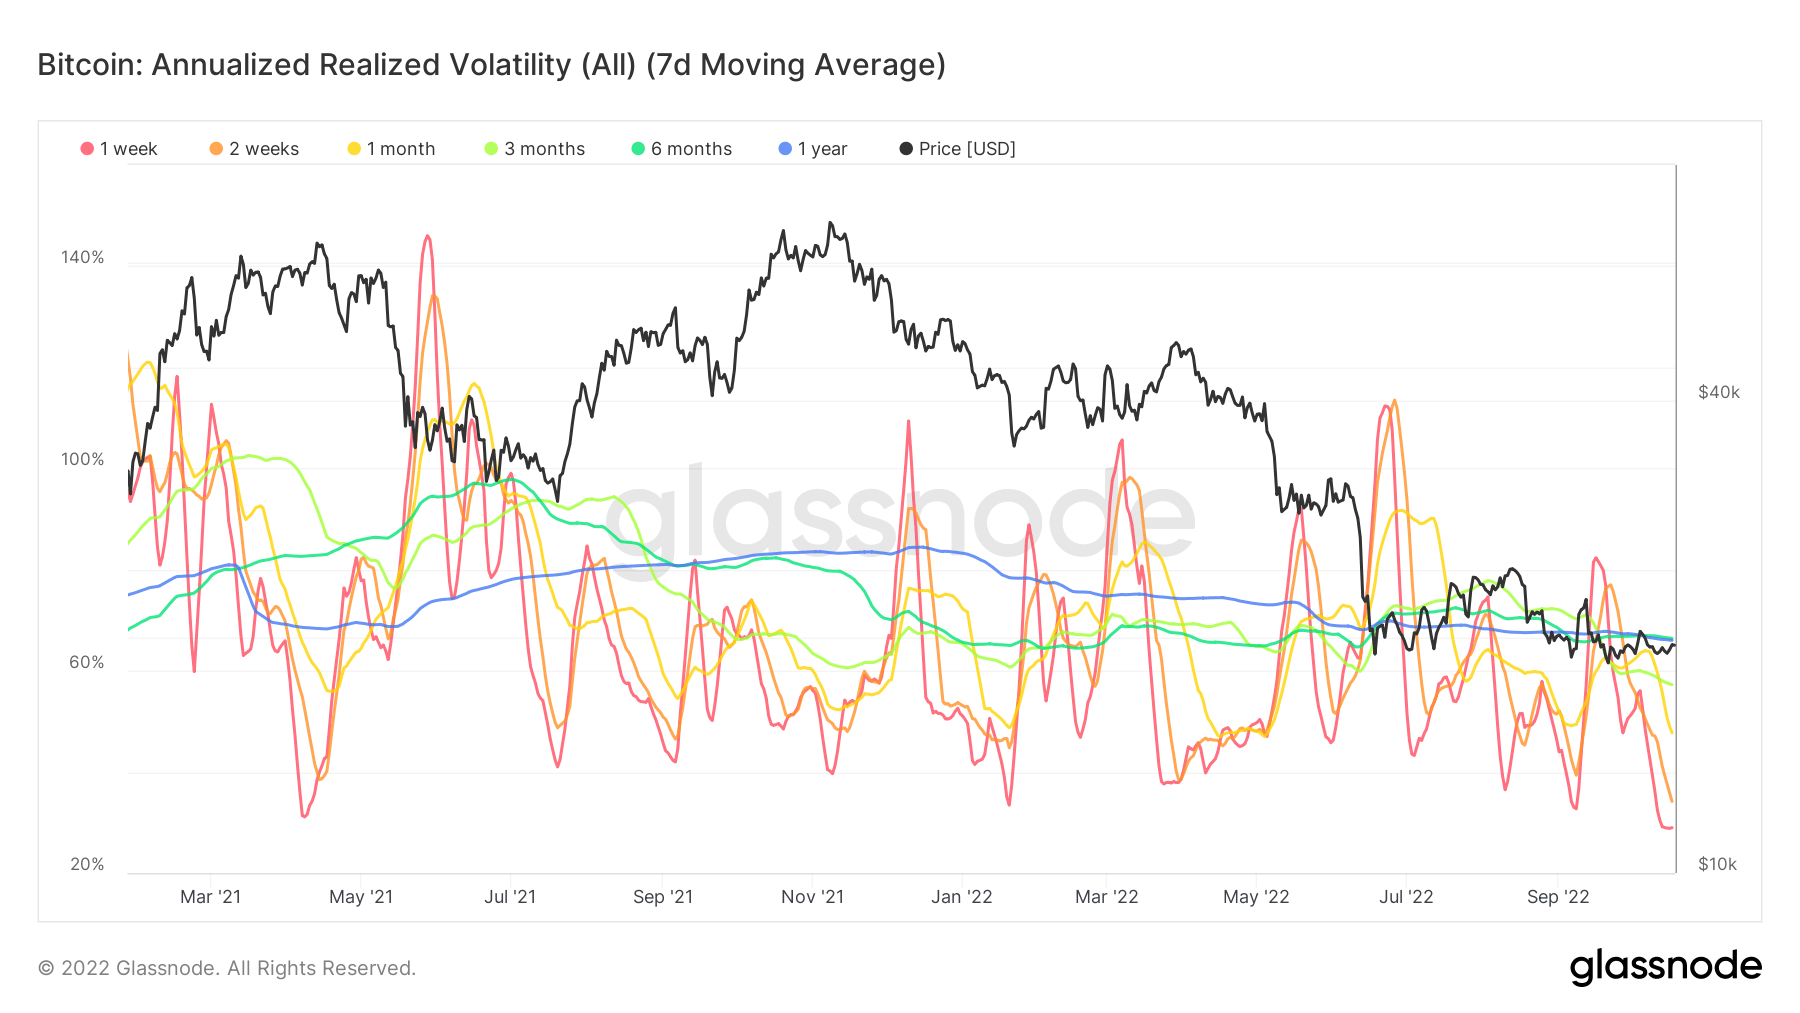
Bitcoin annual realized volatility
Bitcoin annual realized volatility refers to the actual volatility movement of the BTC options market based on a defined historical period.
Data annualization assumes that observations made over specific time periods (in this case 1 week, 2 weeks, 1 month, 3 months, and 6 months) continue over a year.
The chart below shows that realized volatility is at an all-time low, with all timeframes currently below the 1-year line.
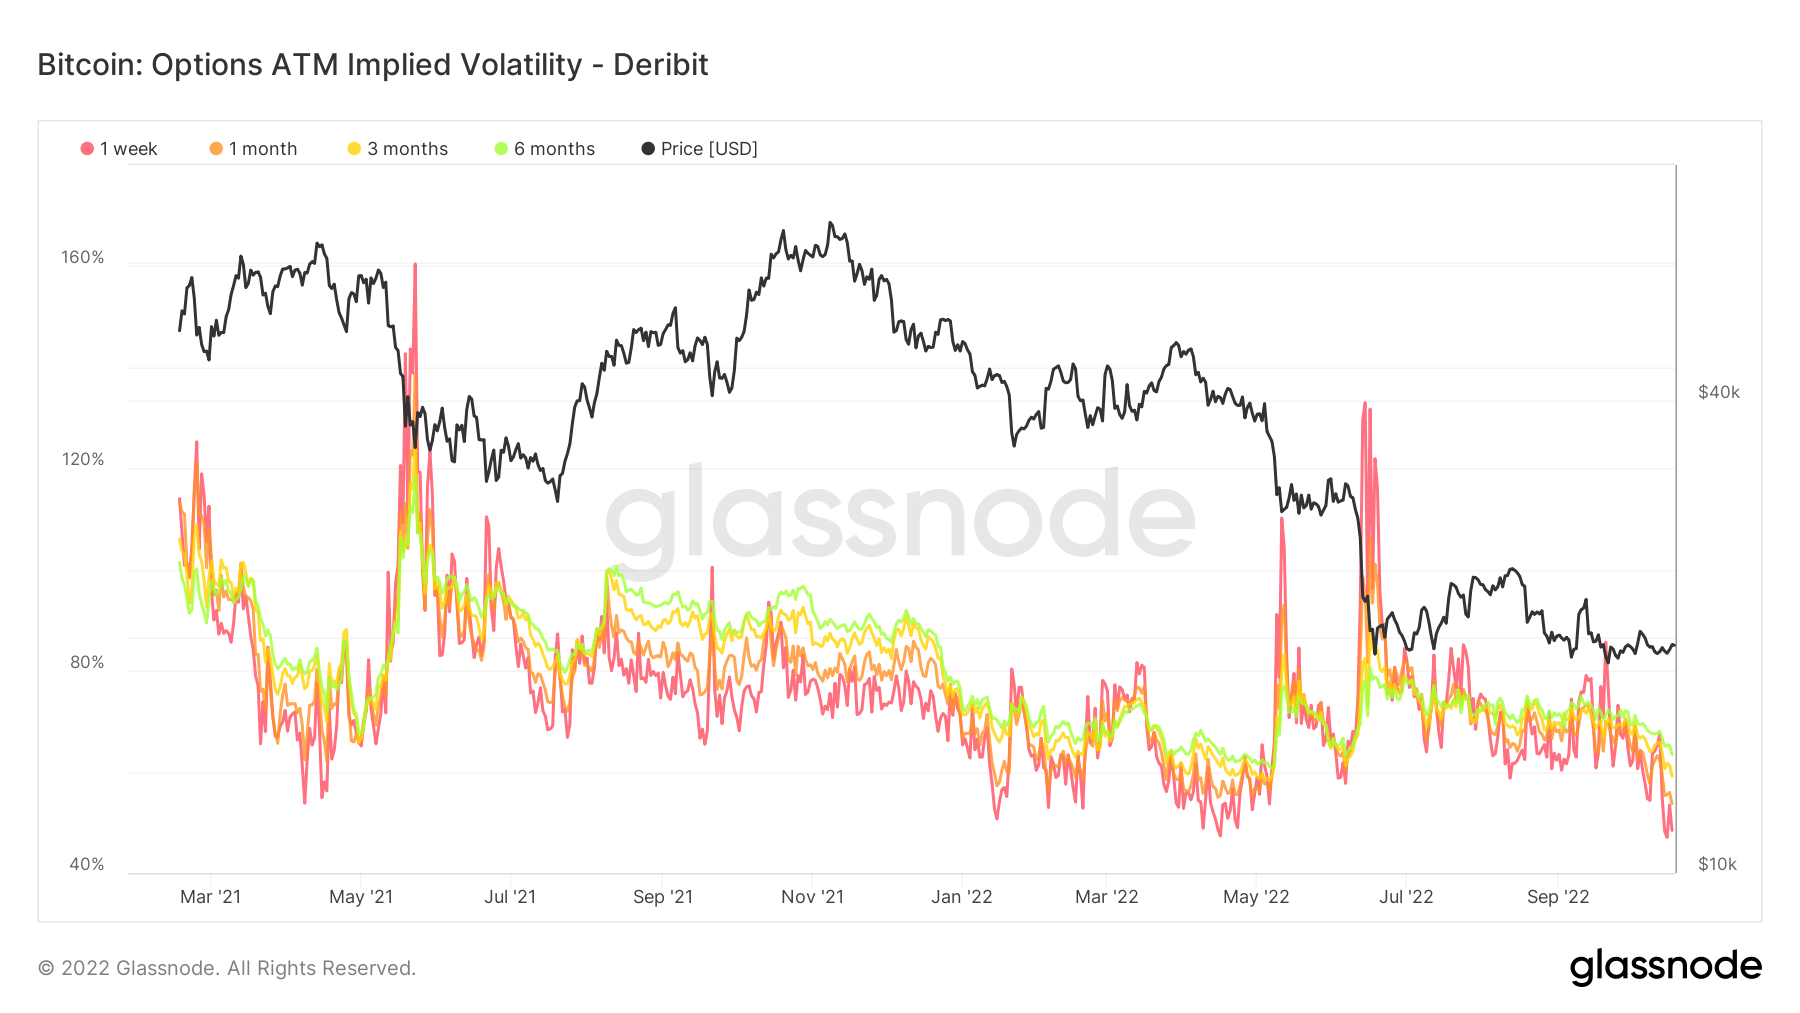
BTC Options ATM Implied Volatility
Realized volatility refers to the market’s assessment of past volatility indicators, while implied volatility relates to future volatility. Implied volatility generally increases during bear markets and decreases during bull markets.
The chart below shows all timeframes where implied volatility has been on a downward trend since late July. Currently, each of the four periods is below 55%, which is encouraging for the bulls.