
Determining market bottoms requires looking at different data sets. However, when it comes to Bitcoin, there are two frequently used on-chain indicators that have historically served as solid indicators of its price bottom – the realized price and the MVRV ratio.
Realized Price calculates the average price of the Bitcoin supply valued on the day each coin was last traded on the chain. Realized price is an important indicator and is considered the cost basis of the market. The MVRV ratio is the ratio between the market capitalization of the Bitcoin supply and its realized value. This ratio is a solid indicator of whether Bitcoin’s current price is above or below its “fair value” and is used to assess market profitability.
The MVRV ratio falls below 1 whenever the Bitcoin spot price trades below the realized price.
Consistent MVRV ratios indicate where support is forming and, when combined with further analysis of realized prices, can indicate market bottoms.
All of Bitcoin’s previous bear market cycles have seen the price fall below the 200-week moving average realized price. Since 2011, the average stint below realization lasted 180 days, with the only exception being March 2020, when the drop only lasted his 7 days.
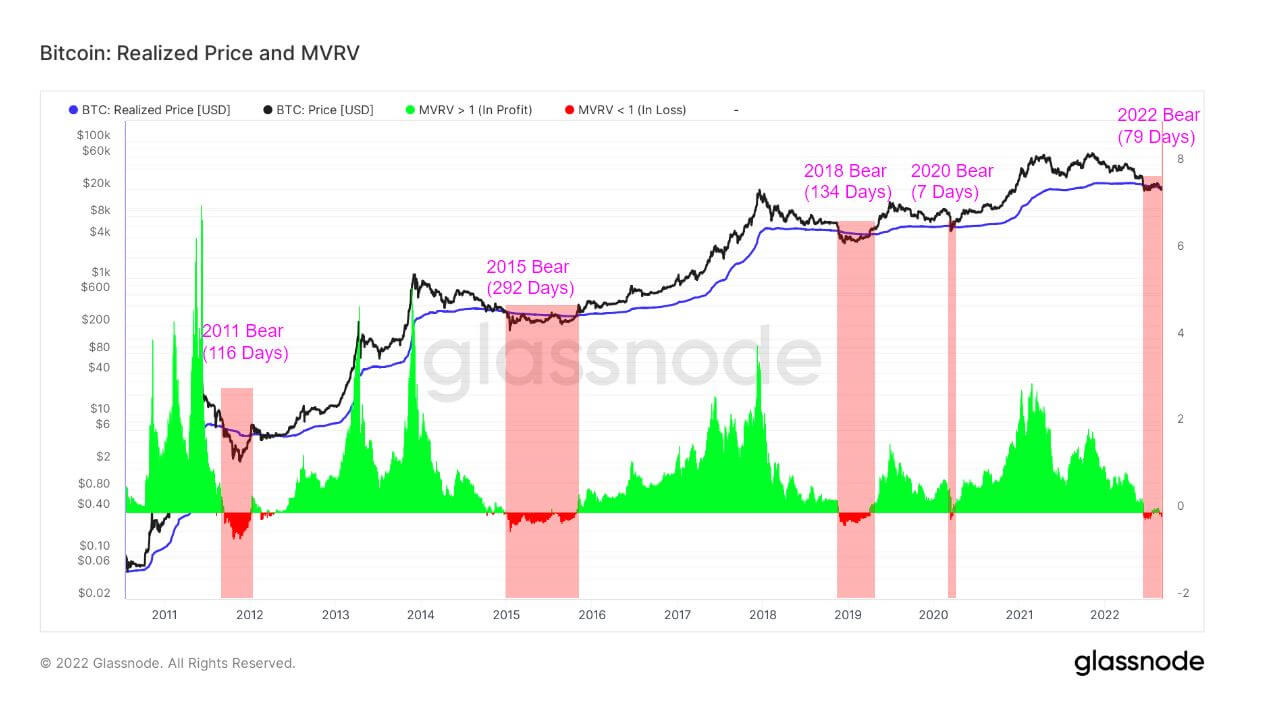
The ongoing bear market that began in May with the Terra collapse shows Bitcoin price below the MVRV ratio for 79 days. Bitcoin price managed to break above the MVRV ratio in the last week of August. However, it is still too early to tell if it marks the end of the bear market.
What it shows is that a strong resistance is forming at the $20,000 levels. This resistance is what ultimately determines the strength of the market and the lows it may fall in future bear cycles.
According to data from glass node, Bitcoin saw a significant increase in relative unrealized losses in August after a similarly sharp surge earlier in the summer. It shows how many coins that were high were lost. A rising Unrealized Loss Score indicates that despite the relative devaluation, the address continues to hold coins and is not losing money.
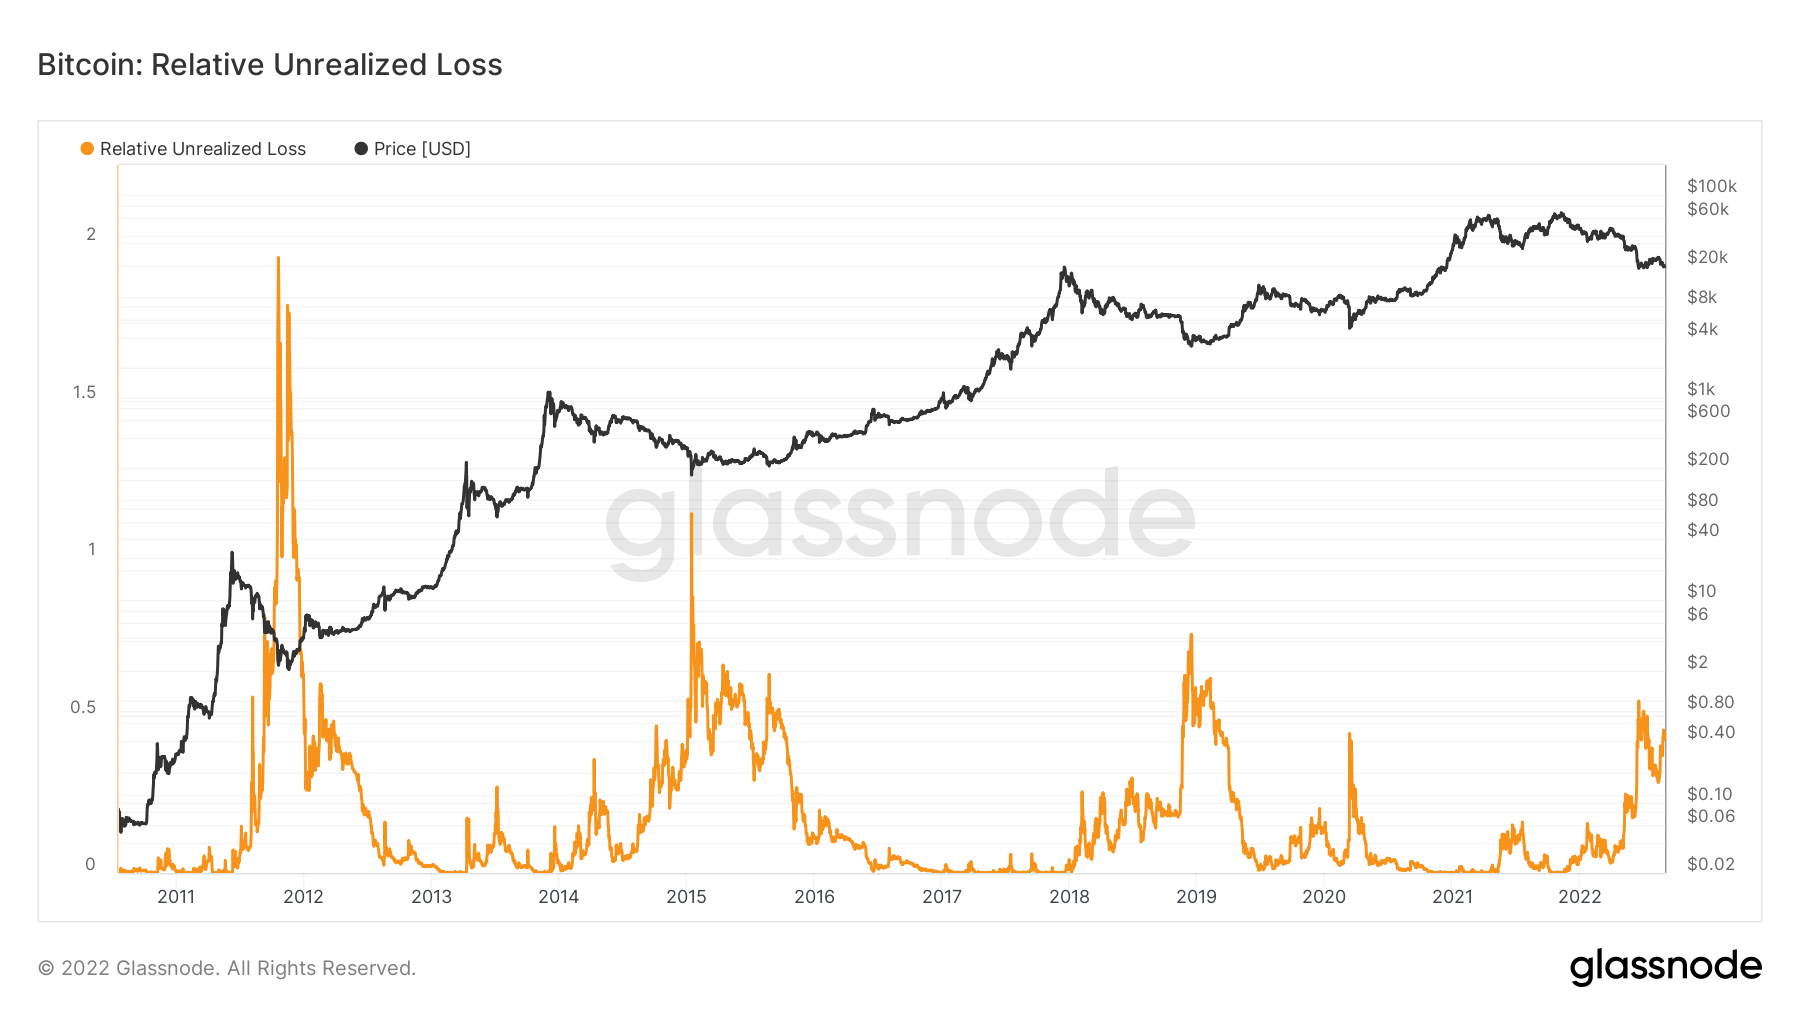
Historical data shows that Bitcoin hit higher lows whenever unrealized relative losses spiked. In every subsequent market cycle, Bitcoin has attempted to retest the highs it reached before the bear market, but has mostly been unable to beat it. It took at least two years to reach its highest price.
Looking at the data shows that a bottom is likely to form. This points to price gains in the coming months, but it could be another two years for the market to fully recover and enter a full-fledged bull market.


