
Bitcoin (BTC) price during the coldest winter in crypto history is very disappointing for investors. At a certain point, prices are lower than they were almost five years ago. Nonetheless, this does not mean that Bitcoin’s price will drop even if we zoom out.
A look at the past significant price drops and bitcoin’s recovery rate reveals that bitcoin hit new highs at the end of each bearish cycle.
price drawdown
Bitcoin’s current price remains at around $19,300, about 72% from the all-time high (ATH) of $69,045 recorded on November 10, 2021. However, this change is relatively normal for Bitcoin, as it fell about 75% to $17,600 in June 2022.
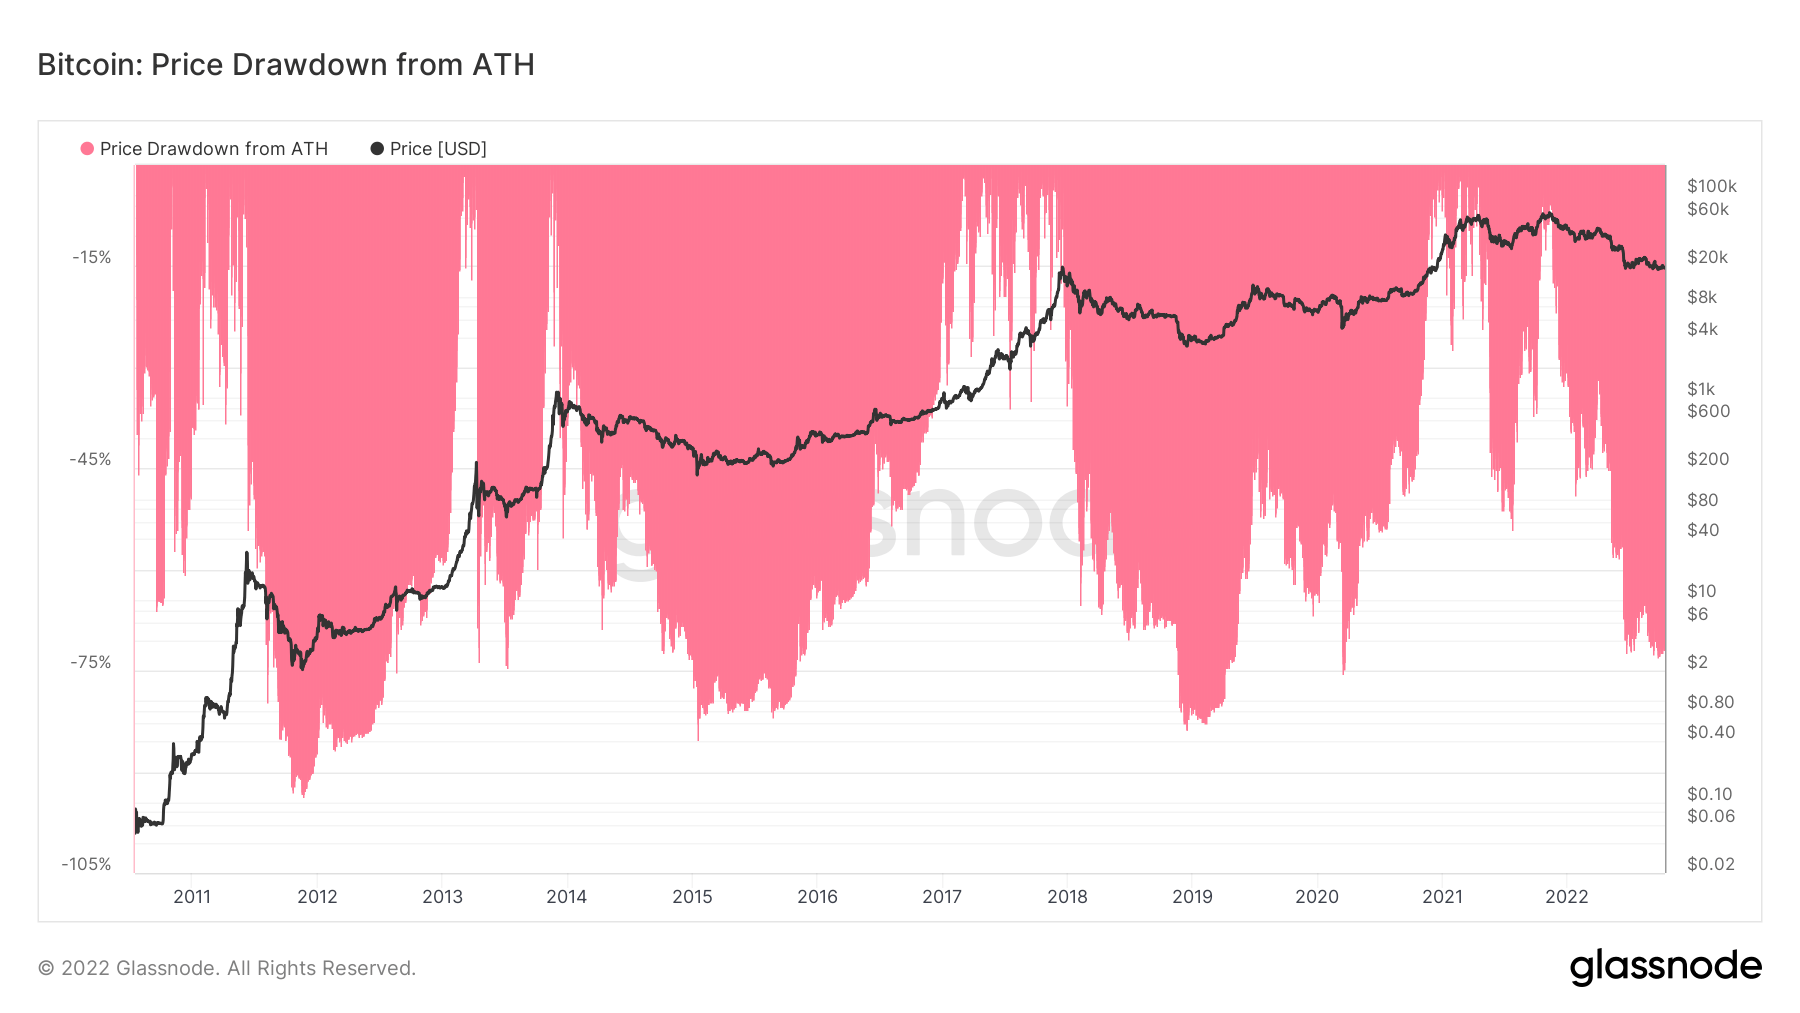
As you can see in the chart above, 2011, 2015, 2019 and 2020 all saw the same drop of 75% or more. These changes show considerable volatility. However, Bitcoin’s price has prevailed each time and has recovered to hit all-time highs.
Bitcoin price breaks the infamous $20,000 support in late August 2022. $20,000 was his ATH point during the 2017 bull market. Breaking past the previous bull market peak is something Bitcoin has never done before and could sway investors.
Is $20,000 the correct benchmark?
$20,000 was actually recorded as the ATH of the 2017 bull market. However, a closer look reveals that the price of Bitcoin was only $20,000 for him in a matter of hours. The average price at the peak of the 2017 bull market was between $8,000 and $10,000.
Meanwhile, the average price from 2018 to 2020 is just above $8,000. The high was $20,000 on December 17, 2017. This continued for several days and the price returned to $10,000 by early January 2018.
As a result, the average price from 2018 to 2020 is close to $8,800, which is the right benchmark to consider.
Artificial $20,000
Bitcoin’s 360-day moving average chart shows that BTC price hasn’t strayed too far from the 360 DMA over 2018-2020.
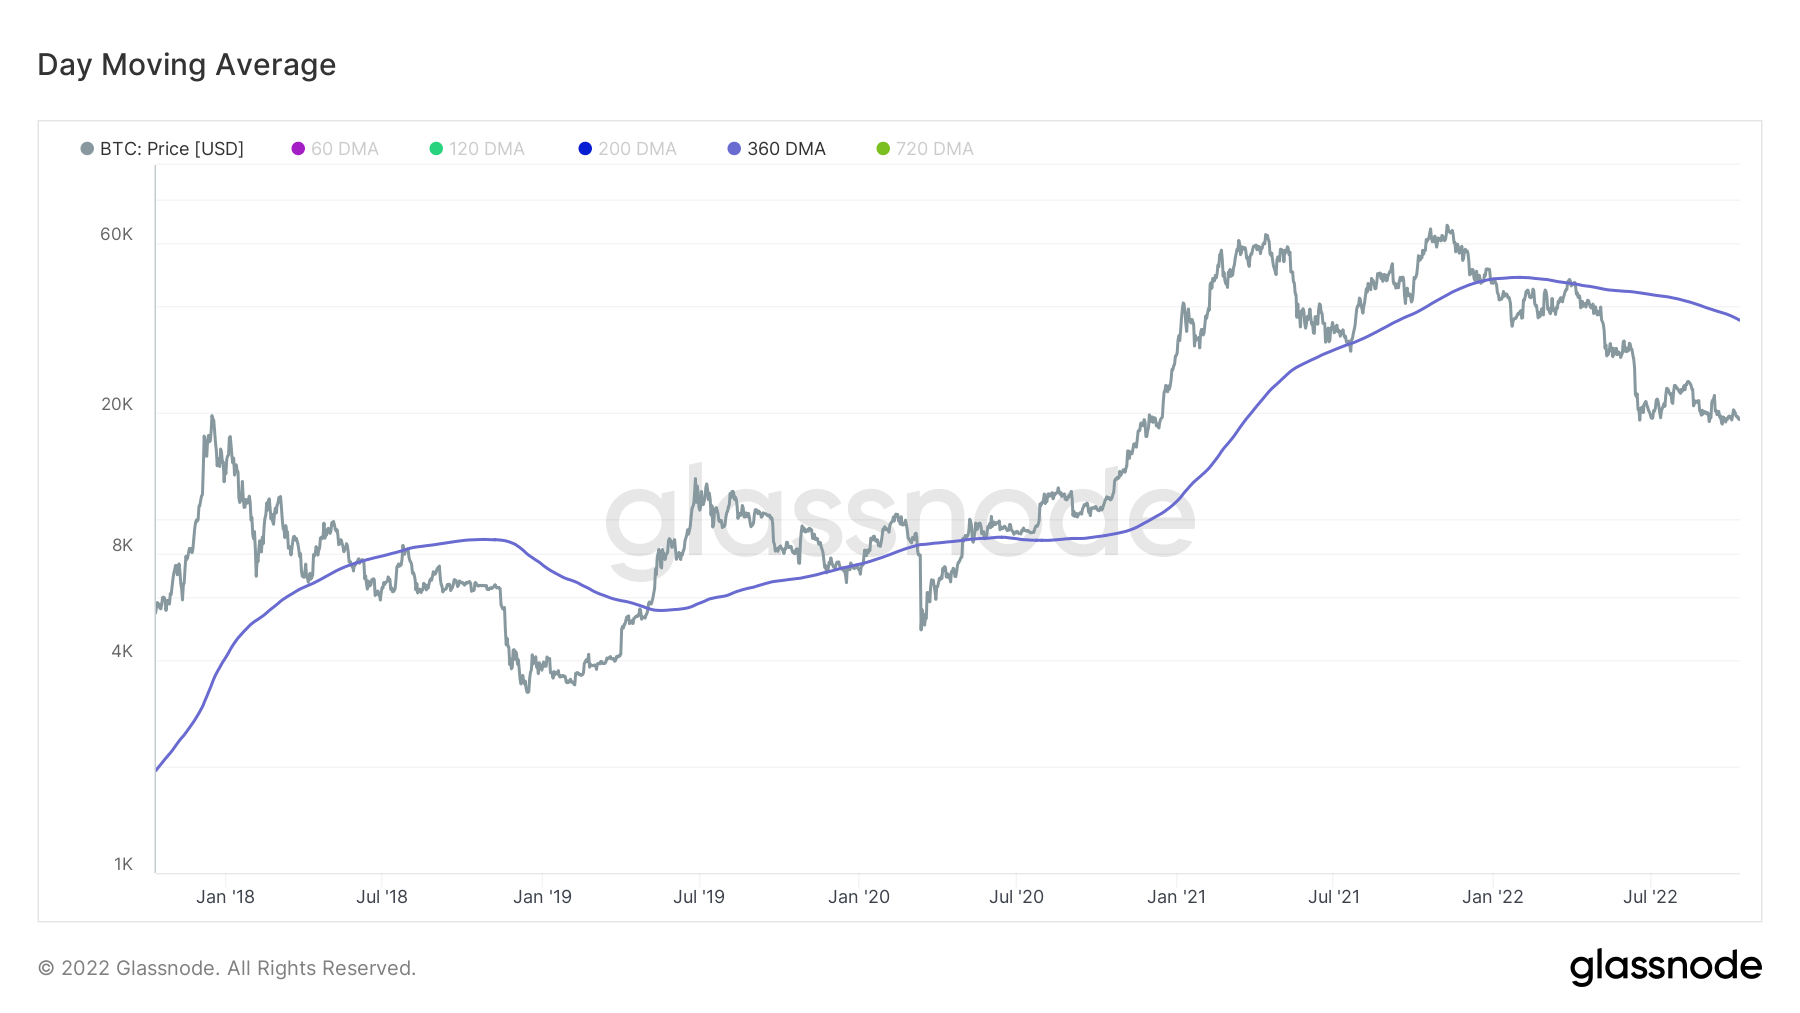
The December 2017 peak price of $20,000 is shown in the chart above as a significant separation from the 360 DMA. This deviation indicates that the Bitcoin price was artificially raised to $20,000.
Looking at the average price and 360 DMA at the end of 2017, it’s clear that Bitcoin has returned to an average price range of around $10,000 and below after the upside effects wear off.
Less than $10,000 to $20,000
All things considered, it’s not entirely true to claim that Bitcoin’s current trajectory is doomed just because it broke the previous bull market ATH below $20,000.
The $20,000 price level reached after the artificial pump could be recorded as ATH at that point. However, according to the data, the average price in 2018 was between $8,000 for him and $10,000 for him.
Considering that the Bitcoin price is currently hovering around $20,000, this represents a 2x increase compared to 2018.