

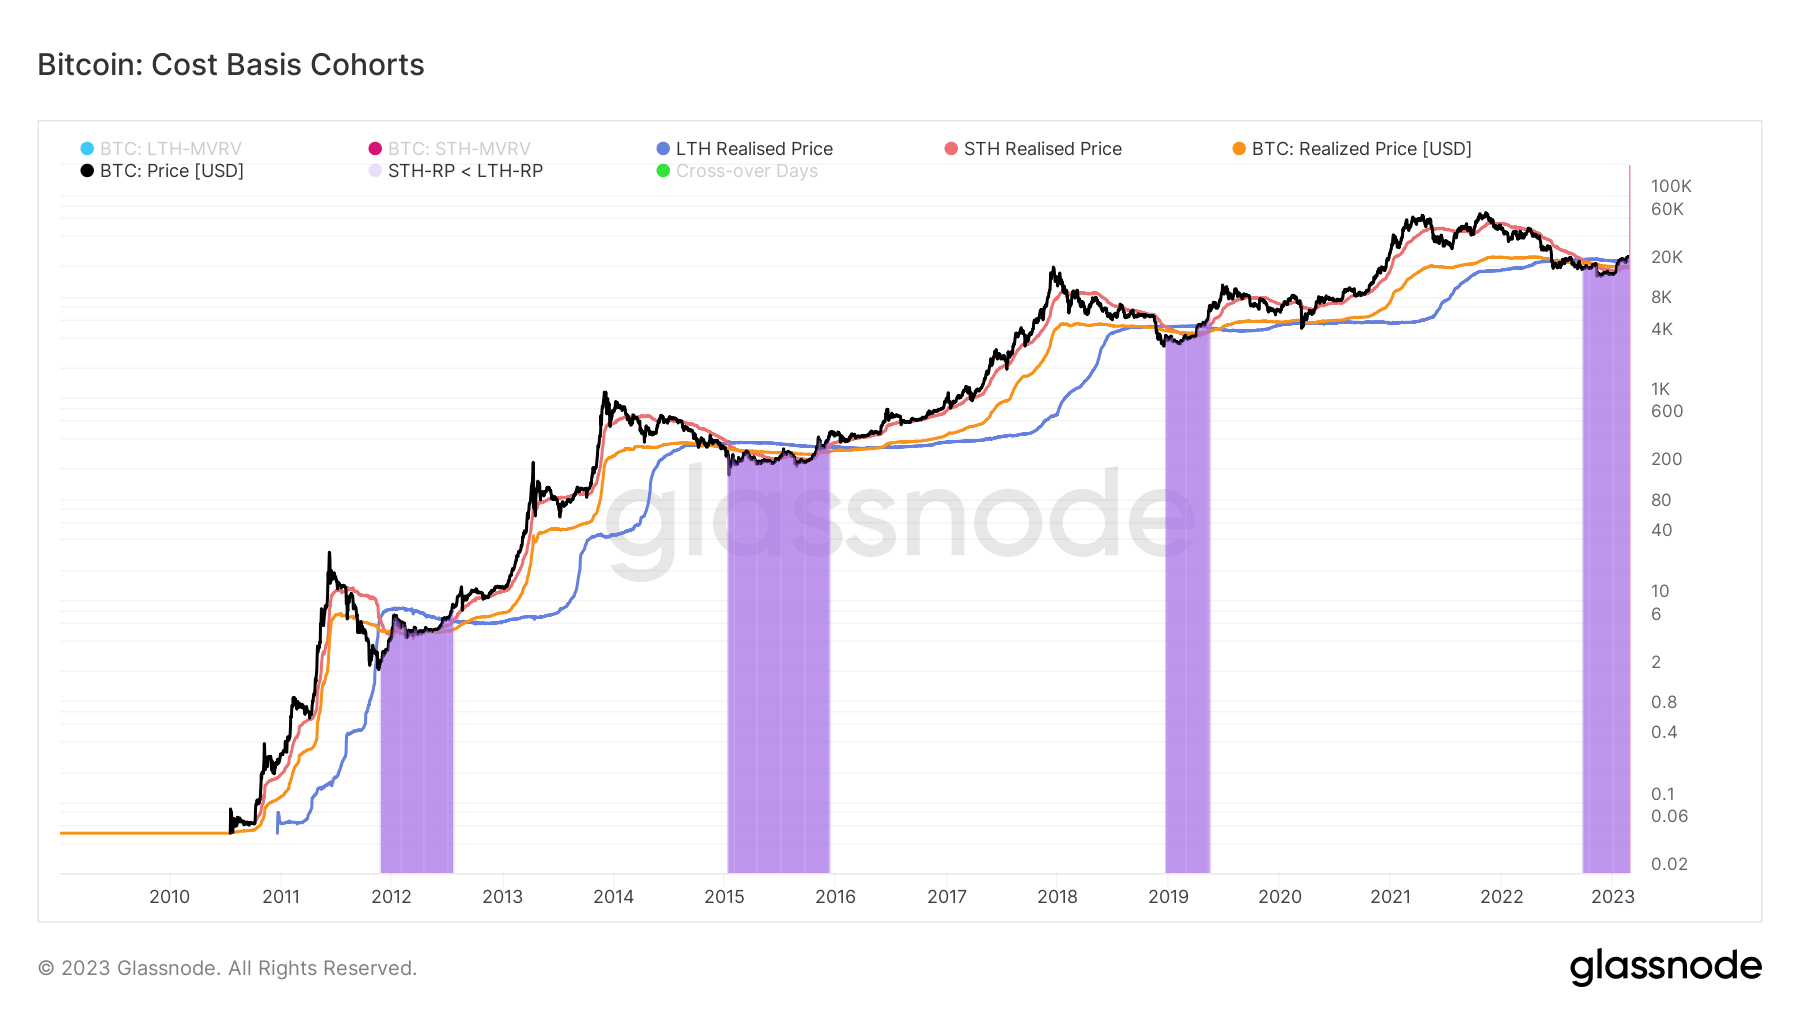
Realized price is an indicator often used to determine market movements in bear and bull markets. The realized price, defined as the value of all Bitcoins at their purchased price divided by the number of coins in circulation, effectively describes the cost base of the network.
Dividing the network into cohorts allows us to reflect the total cost base for each major group of Bitcoin owners. Long-term holders (LTH) and short-term holders (STH) are the two major cohorts driving the market. LTH are all addresses that have held BTC for 155 days or more, and STH are addresses that have held BTC for less than 155 days. .
The LTH-STH cost base ratio is the ratio of long-term holders to short-term holders’ realized prices. Given the historically different behavior exhibited by LTH and STH, the ratio of their realized prices can indicate how market dynamics are changing.
For example, we see an upward trend in the LTH-STH cost basis ratio when STH realizes more losses than LTH. This shows short-term holders selling BTC to LTH, indicating an accumulation phase of the LTH-led bear market.
The downward trend in the ratio shows that LTH is consuming coins faster than STH. This shows the distribution stage of a bull market where LTH sells his BTC for profit and STH buys it.
An LTH-STH cost basis ratio greater than 1 indicates that the LTH cost basis is higher than the STH cost basis. This has historically correlated with surrendering late bear markets that turned into bull markets.
2011
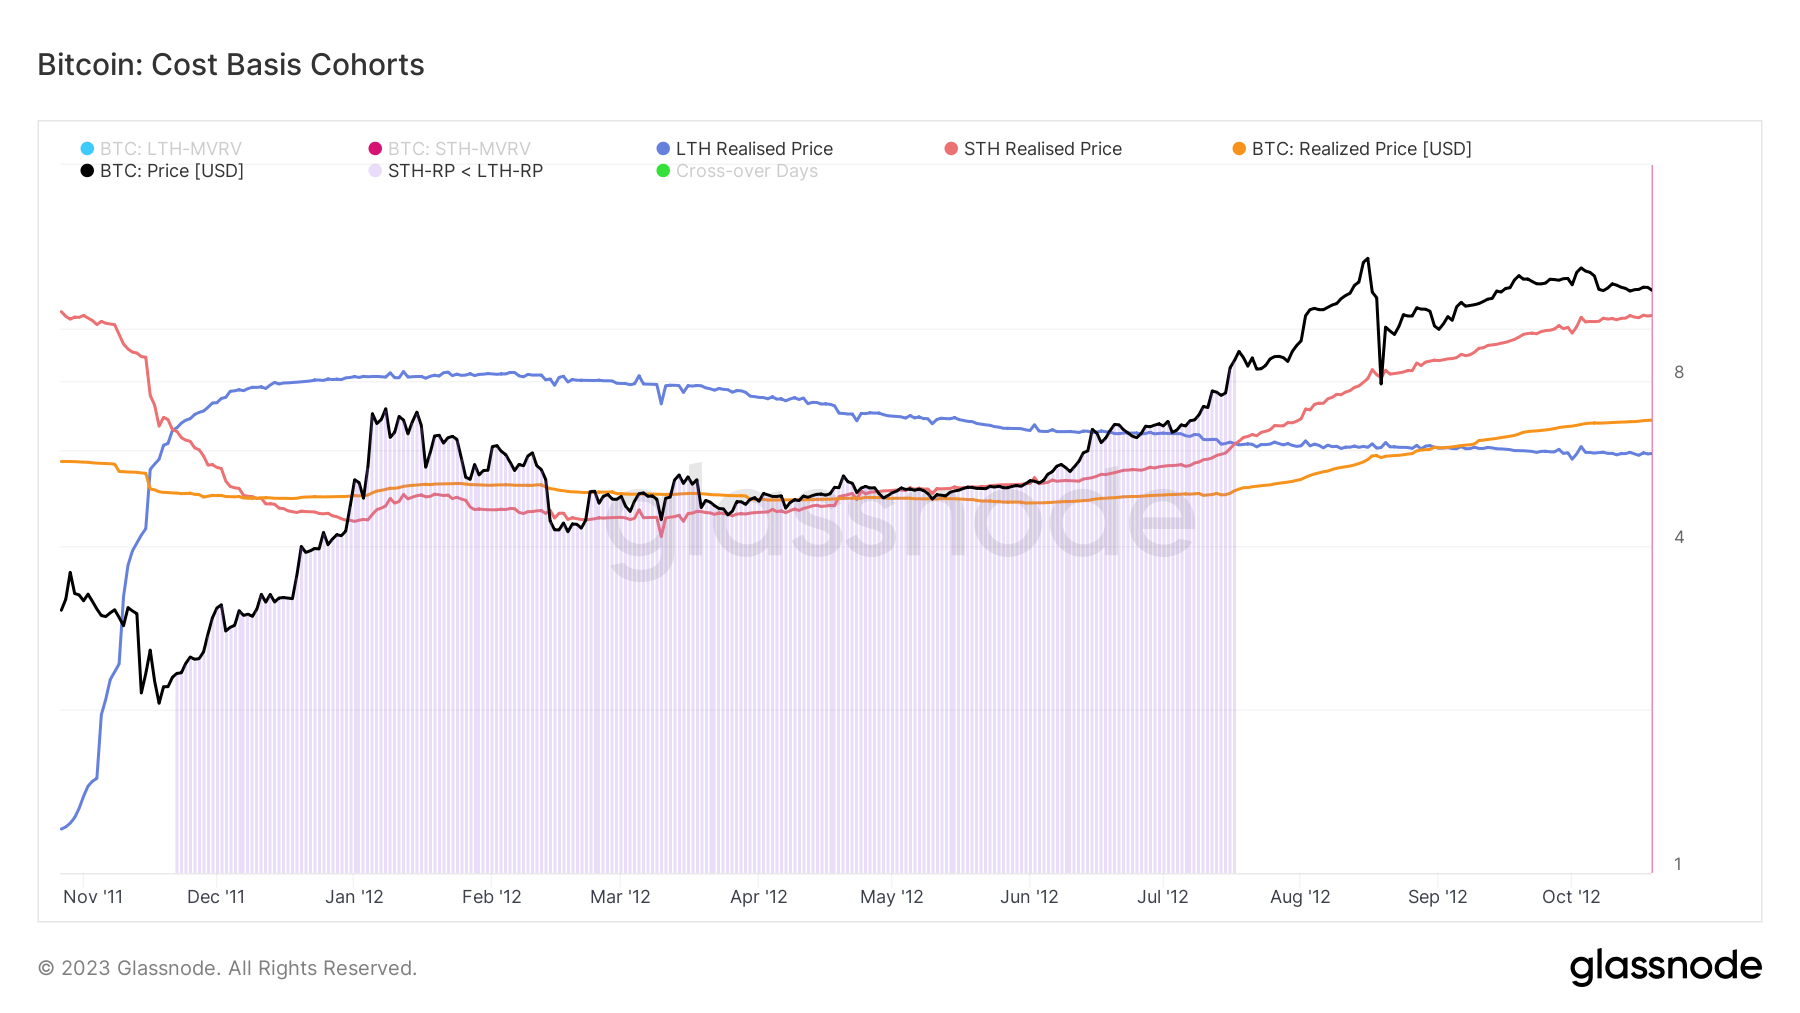
During Bitcoin’s first bear market in 2011, the realized price of STH fell below the realized price of LTH. This trend reversal marked the beginning of a bear market that began on November 22, 2011 and lasted until July 17, 2012.
Long-term holders have accumulated BTC through bear markets, dollar cost averaging (DCA), and falling cost bases. Buying at subdued prices created a new influx of short-term holders that pushed the price of Bitcoin higher. This increase in his STH accumulation increased the STH realization price and increased the network’s overall cost base.
2015
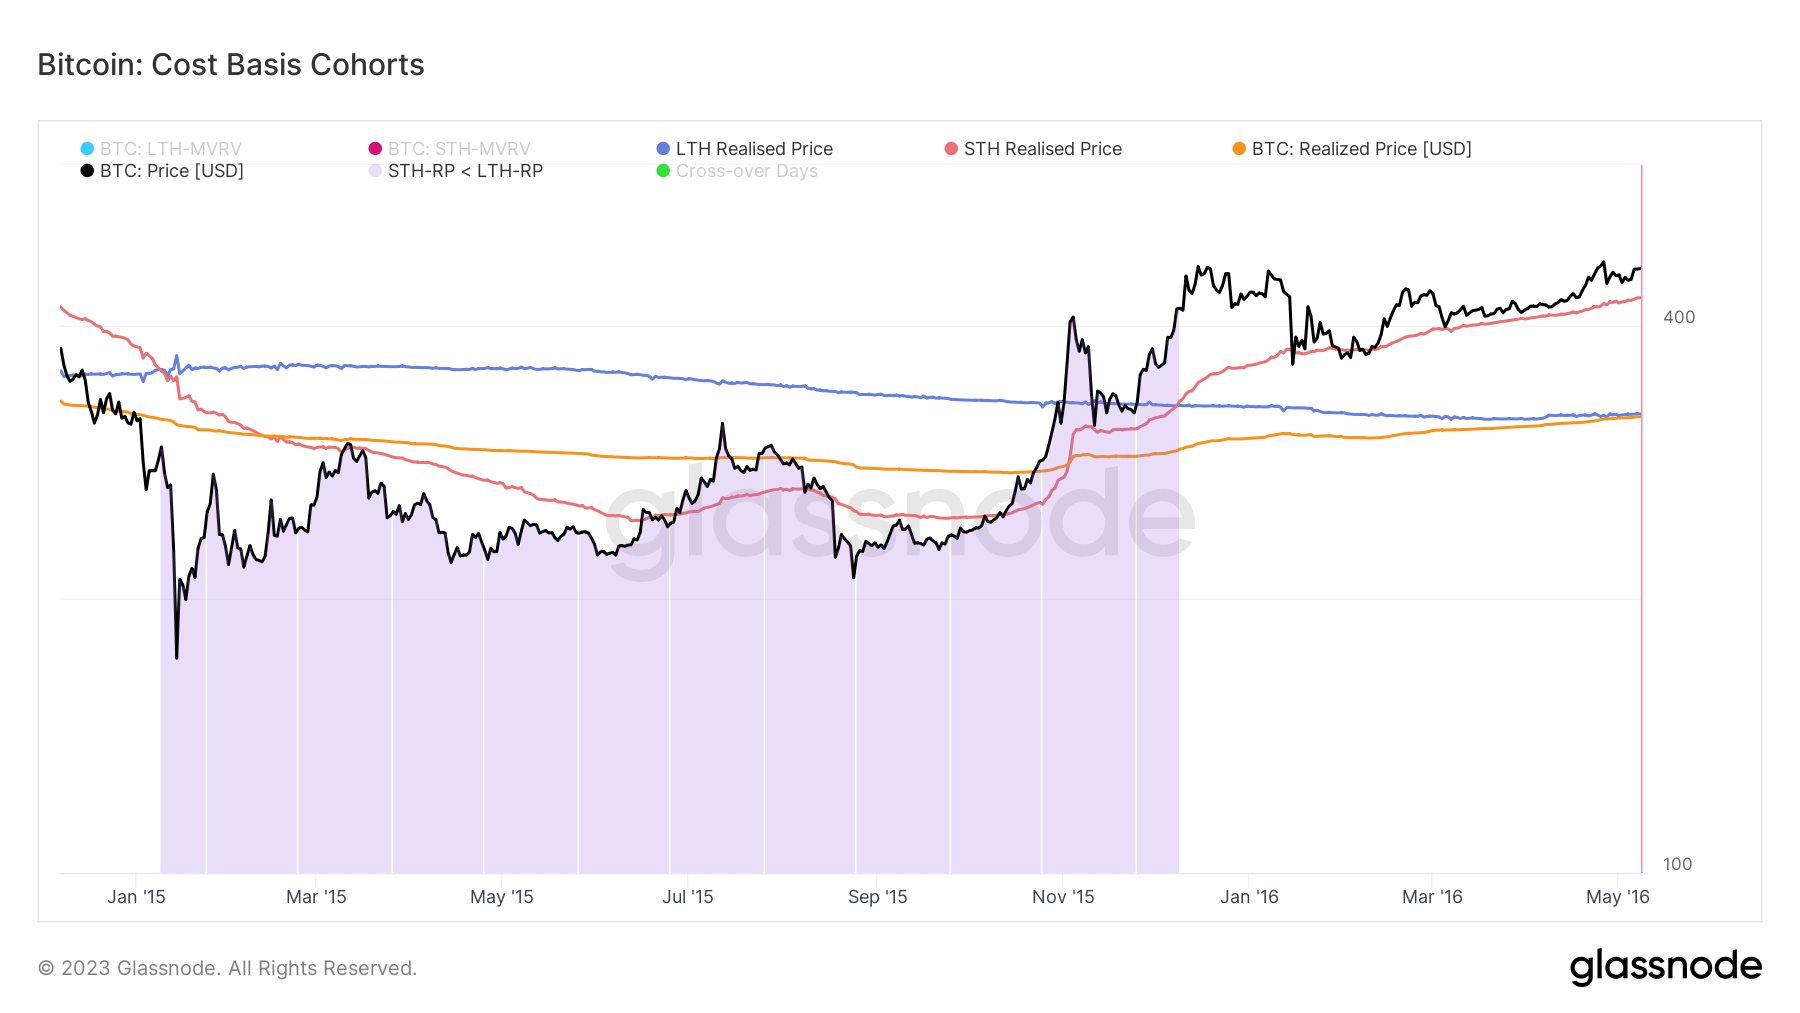
The 2015 bear market followed a similar pattern. On 01/08/2015, the STH realized price fell below his LTH realized price, triggering a bear market that lasted until 12/8/2015.
Bitcoin’s price started to recover in early November 2015, but it wasn’t until early December that the realized price of STH exceeded the realized price of LTH. At that time, the network’s overall cost base rose slightly, triggering a bear market reversal for Bitcoin’s price above $400.
2018
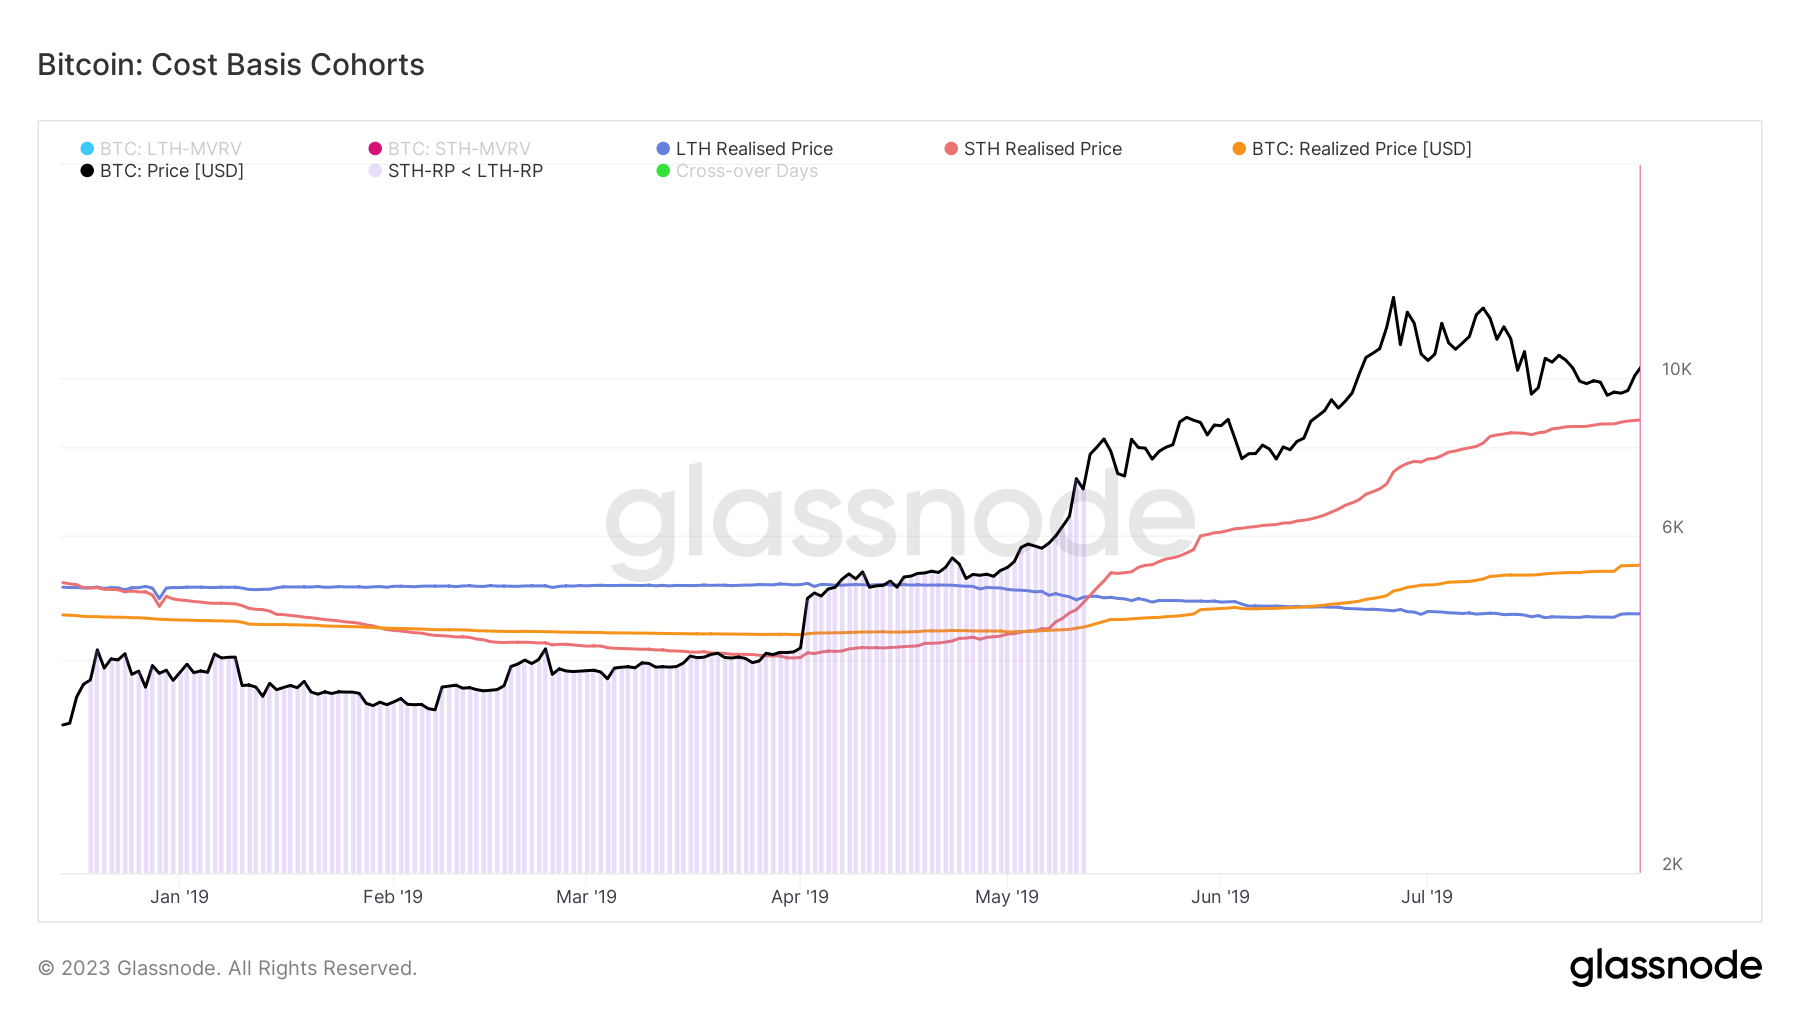
Bitcoin’s coveted rally to $20,000 in late 2018 ended when the STH realized price fell. It fell below LTH’s realization price on December 20, 2018, and Bitcoin’s spot price well below its realization price.
The bear market ended on May 13, 2019 with the STH realized price surpassing the LTH realized price.
2022
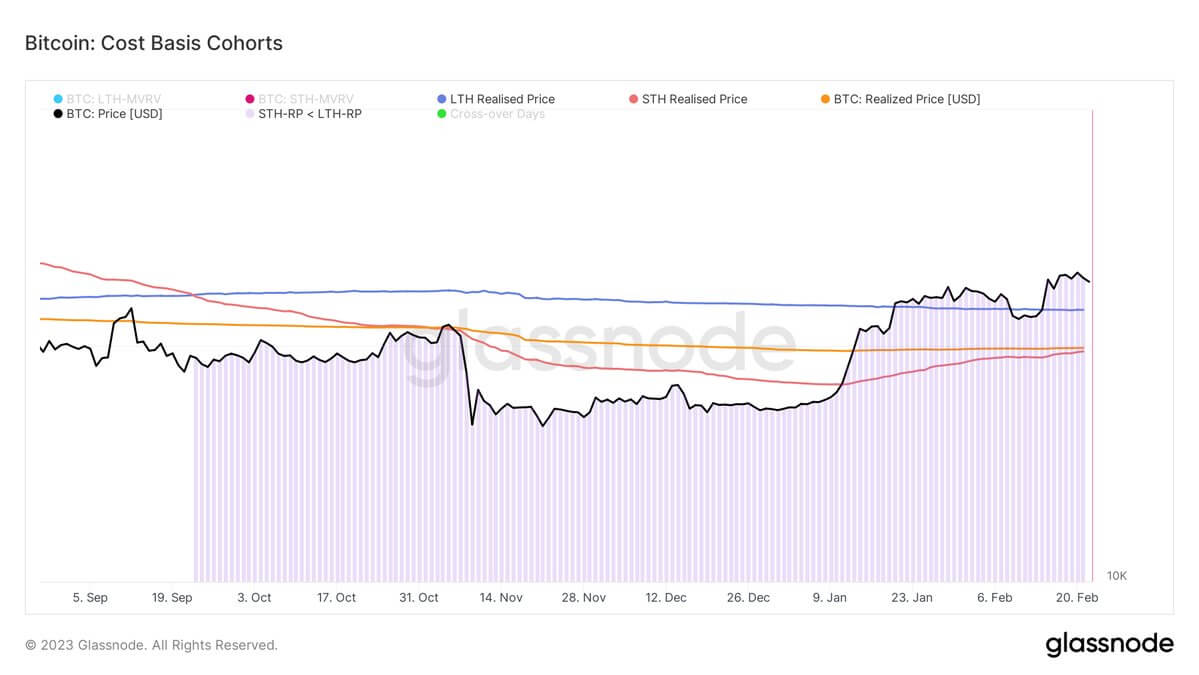
The realized price of STH began to fall in early September 2022, below the realized price of LTH on 22nd September 2022. It continued its downward trajectory until January 10, 2023, when it began a slow and steady rally to almost parity. at the realized price of Bitcoin.
The realized price of STH is currently $19,671 and the realized price of LTH is $22,228. The realized price of Bitcoin is $19,876.
Data analyzed by CryptoSlate showed that the four-year cycle of the Bitcoin market ends when the STH realized price overturns both the Bitcoin realized price and the LTH realized price. This creates a measurable market FOMO that triggers a parabolic run.
This reversal occurred nine months after a bear market in 2011, 11 months after a bear market in 2015, and six months in 2019. In 2022 it has been 5 months since his STH Realization Price fell below his LTH Realization Price.


