
A decentralized exchange (DEX) is a core Web3 infrastructure with proven use cases. As we continue to participate in the blockchain economy, people will need a place to exchange tokens without middlemen or centralized entities.
However, comparing dozens of platforms for sustainability and potential is more difficult than describing technology as a whole. It is unknown which one will last for several years.
For example, Uniswap has become a DeFi institution of excellence. But how do you compare the token values of smaller DEXs such as TraderJoe and Biswap?
Since the most important indicator of an exchange platform’s health is people using it, in this article we’ll look at metrics that can be used alongside others to evaluate DEXs: Share of trading volume to market capitalization, or SOTV/MC. This can be used to analyze the market performance of DEXs.
What is DEX?
DEX is a cryptocurrency trading platform that does not rely on third-party services for custody. All transactions are completed directly on the blockchain through smart contracts and off-chain protocols. Unlike most centralized exchanges that require users to provide personal information, DEXs allow users to remain anonymous when trading. All other users can see your wallet’s “public address”. For Ethereum, this is his 42-character hexadecimal address starting with 0x.
-
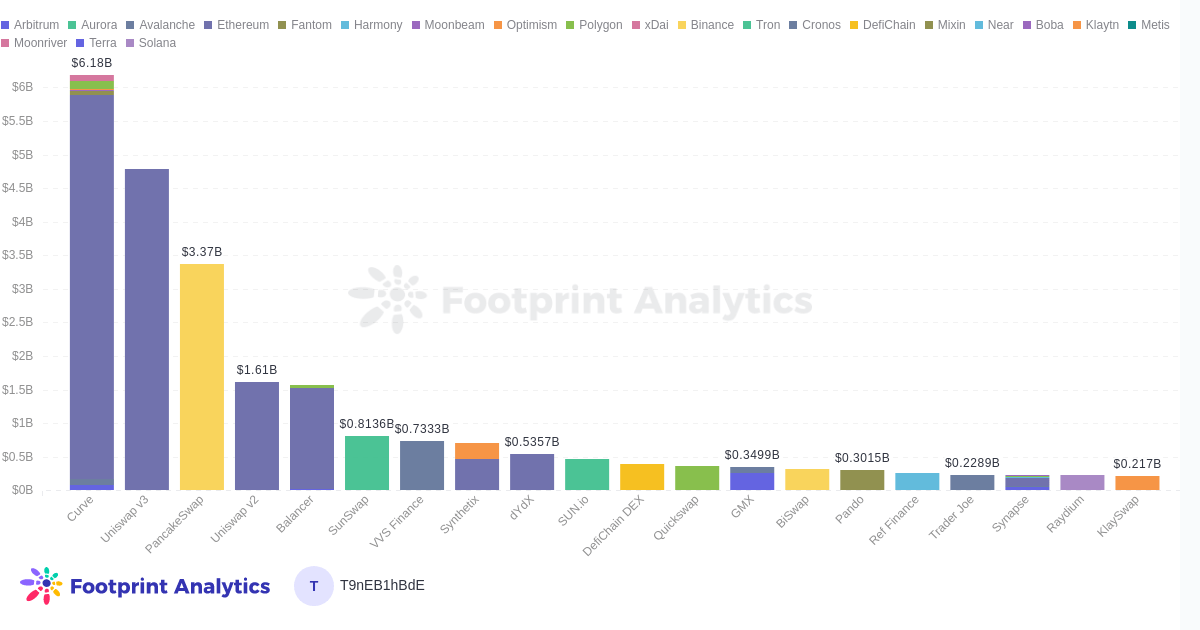
Top 20 DEXs and their TVLs on different chains -
Why Market Capitalization Matters to DEXs
Market capitalization is one of the most important factors to look at when analyzing cryptocurrencies. Market capitalization is calculated by multiplying the circulating supply of an asset by its current price. For example, if 100,000 units of a particular crypto asset are worth $1, its market cap would be $100,000.
Market capitalization indicates how big a cryptocurrency is compared to other currencies within the industry and is often used as a benchmark for the popularity and desirability of cryptocurrencies.
A company with a higher market capitalization can be viewed as more valuable than a company with a lower market capitalization, but this is not always the case. By comparing DEX market capitalization and its usage (using SOTV as a proxy), we may be able to assess whether the protocol is overvalued or undervalued. Or you may find other discrepancies pointing to features or bugs that are not well known to market participants.
When calculating market capitalization, it is important to remember that there are different types of DEX tokens and their use cases make meaningful sense to users. For example, CAKE (PancakeSwap) is a common utility token with governance, while CRV (Curve) is entirely governance.
-
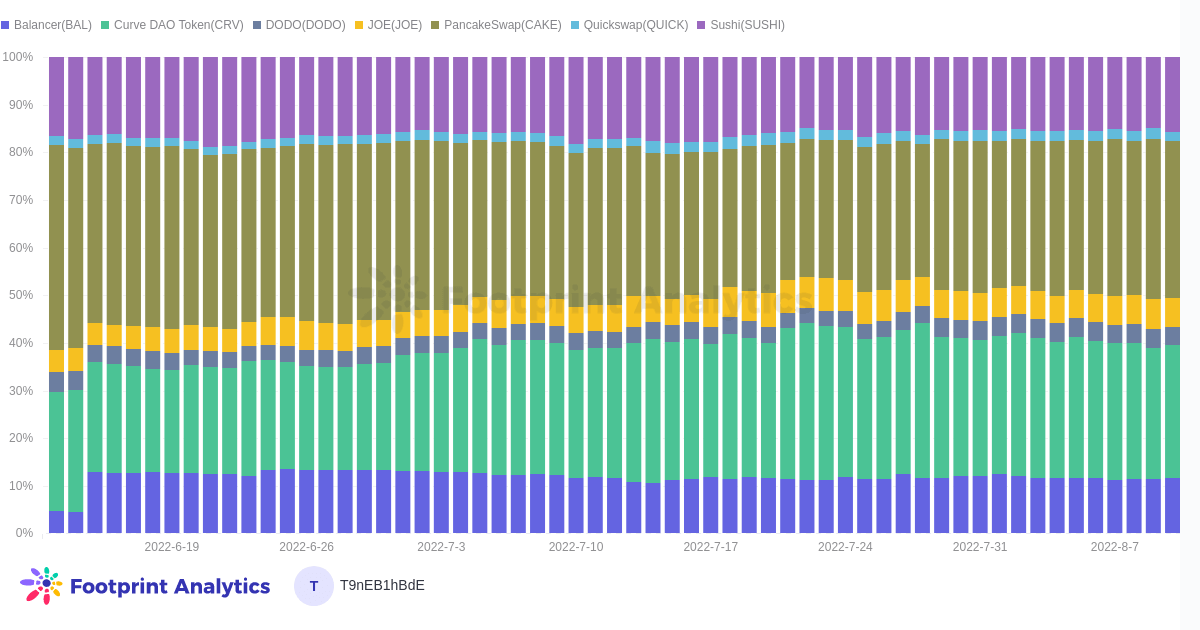
A basket of 7 DEXs and their share of market capitalization. -
What is the share of traded volume (SOTV) metric?
SOTV can be calculated by dividing the total daily trading volume of the DEX by the total daily trading volume of all exchanges.
SOTV provides insight into how much activity is occurring within a given ecosystem and serves as an indicator of the relative health of the ecosystem and, where applicable, the prospects of its native token.
By watching SOTV/MC, you can also explore how market prices for different tokenomics have a significant impact on projects and developers. For example, comparing two of his DEXs with similar ecosystems, features, and trading volume, but different supply and token mechanics, how those differences affect the market capitalization and amount of speculative investment in those projects. You can check if it affects you.
-
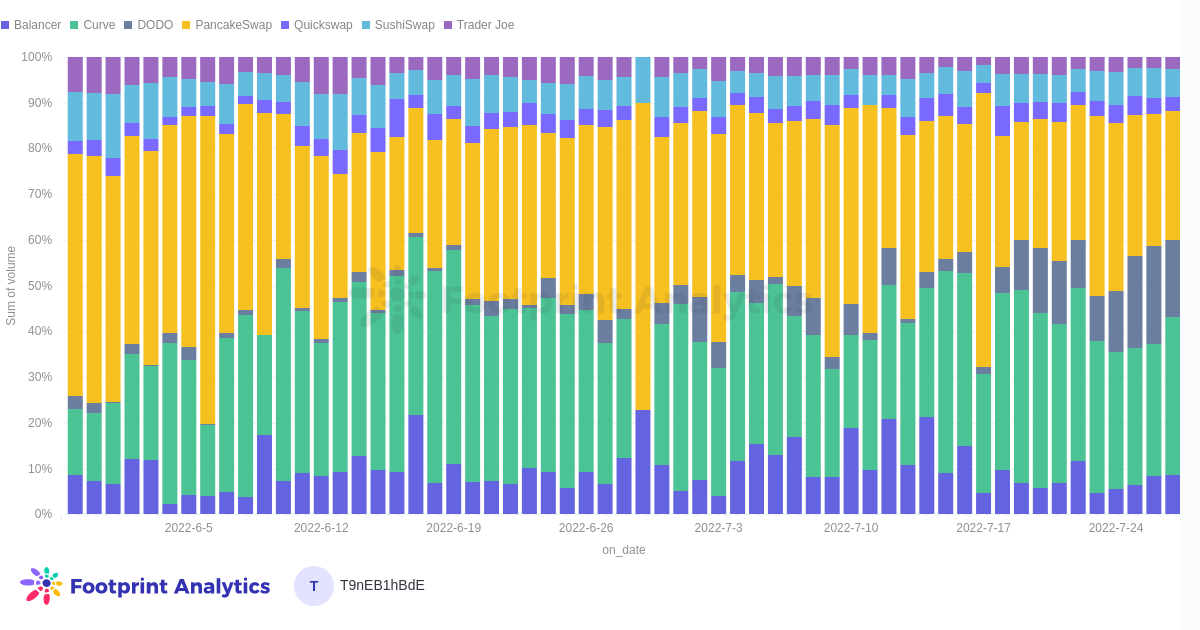
7 Basket of DEX and share of trading volume. -
Hypothesis discovery based on SOTV/MC
SOTV/MC ratio is a context metric. That is, it should be applied to a limited sample of protocols that we plan to analyze together. This is because the DEX is so diverse that over-extending the range can lead to erroneous results. Data output is just as good as data input.
In this batch, we analyzed 7 major DEXs besides Uniswap that have a standard suite of DEX features as Uniswap is in its own class as a market leader. Such outliers skew the data. We also removed Sunswap and VVS as they are completely within their respective ecosystems. Another example of a virtual batch that makes sense is “DEX with futures trading” such as dYdX, MCDEX, Perpetual Protocol.
The higher the SOTV/MC, the more overvalued the DEX’s market capitalization relative to its trading volume.
For example, analyzing the two largest DEXs in one ecosystem, DEX A has a daily trading volume of $600 and a market capitalization of $400. DEX B only trades at $400 per day, but for some reason it has a market cap of $600.
To calculate the SOTV/MC of DEX A, divide the share of trading volume of 60 by the share of market capitalization of 40. The result is 1.5. For DEX B, divide 40 by 60 to get 0.6. In theory, DEX A is underrated, but it’s important to remember that this metric only tells a fraction of the story.
Here are some results from running SOTV/MC analysis on Balancer, Pancakeswap, Sushiswap, Curve, DODO, Quickswap, and TraderJoe. The entire dashboard can be found here.
Is CRV Currently Underrated?
Curve SOTV/MC: 1.2
Pancake Swap SOTV/MC: 0.9
Curve and Pancakeswap are the two main DEXs after Uniswap. Curve’s SOTV is nearly 6% higher than Pancakeswap, but CRV and CAKE market caps are roughly even (CRV is trending up, CAKE is trending down). While the primary use cases are vastly different, Curve’s, facilitating his DeFi for stablecoins, is more secure than Pancakeswap, a Layer 1 DEX with a huge number of small denomination “memecoins” listed. It can be argued that it is a fair bet. However, CAKE has broader utility than CRV.
Is DODO a hidden gem?
Dodo SOTV/MC: 4.5
DODO’s SOTV is 17% as of July 27th, making it the third largest DEX in the group. However, its market capitalization is relatively small at 3.7% he. For DEX bullish investors, DODO is a protocol worth considering.
How valuable is DEX branding?
Trader Joe SOTV/MC: 0.4
Quick Swap SOTV/MC: 1.3
Two new DEXs with similar SOTVs are TraderJoe at 2.7% and Quickswap at 3%. But TraderJoe’s market cap is 6.7% of the group, while Quickswap is significantly lower at 2.2% of his. Immediately, TraderJoe’s strong branding and marketing pops out as the only thing that sets it apart from Quickswap, which is very similar to his other DEXs in terms of appearance. Or is the key point that Quickswap has some seriously dormant features that allow for future growth?
Conclusion
We believe it is important to track multiple metrics when analyzing the state of an exchange. SOTV/MC is one of those metrics.
date: August 23, 2022
author: james
Source: www.footprint.network
What is footprint analysis?
Footprint Analytics is an all-in-one analytics platform for visualizing blockchain data and discovering insights. It cleans up and consolidates on-chain data, so users of all experience levels can start exploring tokens, projects, and protocols right away. With over 1,000 dashboard templates and a drag-and-drop interface, anyone can create their own customized charts in minutes. Uncover blockchain data and invest smarter with your footprint.


