“Fair value” is a term that is rarely used in the crypto market, but it helps investors position their transactions to get the most out of the volatile market. By knowing the “fair value” of crypto assets, investors can know whether the asset is overvalued or undervalued at its current price.
The ratio that shows the difference between the market capitalization of an asset and the realized market capitalization is called the MVRV-Z score. The score also shows the standard deviation of all historical market capitalization data.
Historically, the MVRV-Z score has been used to mark the top and bottom of the Bitcoin market cycle with impressive reliability. A high MVRV-Z score usually showed the top of the market, and a low MVRV-Z score showed the bottom of the market followed by a rise.
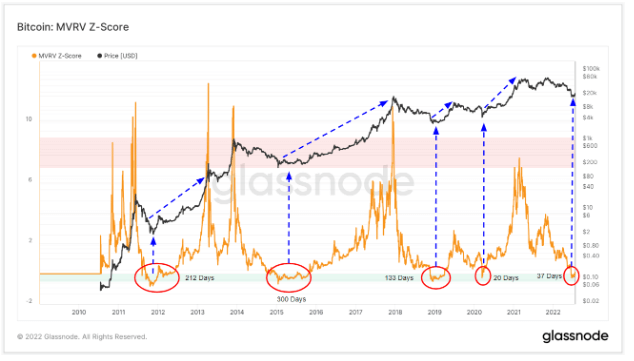
In the graph below, Bitcoin prices are perfectly correlated with the market tops predicted by the MVRV-Z score. The overheated market cycle pushed Bitcoin’s MVRV-Z score deep into the red zone, always leading to aggressive price declines. On the other hand, if the market price falls below the time of realization, it has shown the bottom of the market.
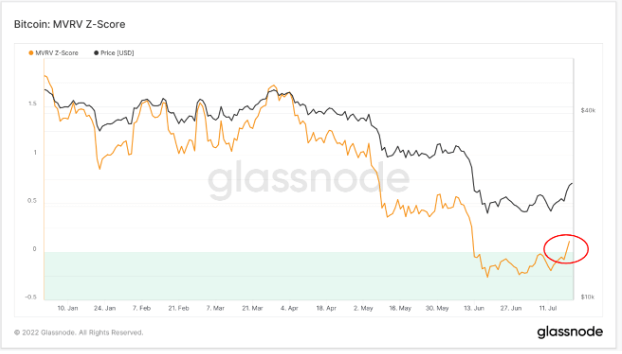
In June, the MVRV-Z score dropped sharply and entered the “green zone”. This is a move that marks a potential price decline in this bear market.
According to Bitcoin’s previous MVRV-Z score, the bottom of the last cycle occurred in March 2020, and the start of the COVID-19 pandemic caused investors to rush out of cash, causing the global market to plummet.
The MVRV Z-Score correctly calls the bottom of the last four bear markets. The graph above shows that the MVRV-Z score spent 212 days in the green zone in 2012. In 2015, the MVRV-Z score spent more than 300 days in the green zone. In 2019, the low MVRV-Z score lasted 133 days, but in 2020 he spent only 20 days in the green zone. The green zone on the MVRV Z score chart indicates that Bitcoin is “undervalued”.
Still, the MVRV-Z score is not absolutely certain.
This ratio does not predict how long an asset will remain undervalued or overvalued and will not show an identifiable repetition pattern. Since the ratio does not take into account the macroeconomic factors that influence price fluctuations, the time spent in the green or red zone of the score can also vary significantly.
For example, consider the March 2020 global market plunge. The crash, caused by the launch of aggressive economic measures to combat the COVID-19 pandemic, wiped trillions from the global economy and destroyed the crypto market. Bitcoin’s MVRV-Z score experienced a sharp drop at that point. This indicates that the asset is significantly undervalued. However, it remained undervalued for only 20 days, as most of the stimulus checks offered by central banks around the world went directly into the crypto market, especially Bitcoin.
After spending 37 days in the “green zone”, Bitcoin’s MVRV-Z score increased, indicating that assets are no longer undervalued. This may indicate a resurgence of bullish sentiment in the market, but investors should continue to be aware that this is not the first time Bitcoin’s MVRV-Z score has temporarily left the green zone. there is.
Bitcoin may continue to move in and out of the “not undervalued” category until global macro sentiment changes and Bitcoin demand returns to pre-crash levels.