

The moving average (MA) is a stock indicator commonly used in technical analysis. As its name suggests, this indicator smoothes price data by creating a constantly updated average price over a specific time period.
In technical analysis, moving averages help identify trend direction by analyzing previous price action.
Moving averages are widely used when analyzing Bitcoin prices. Of all cryptocurrencies, Bitcoin behaves the most like a stock and has historically responded well to such analysis.
Technical analysis (TA) remains a controversial topic in the cryptocurrency industry, but analyzing Bitcoin’s MA can be used along with other indicators to determine the current state of the market.
In the Bitcoin context, moving averages can be used to identify where support and resistance are forming. Looking back at historical data, moving averages can be used to identify periods when Bitcoin’s price fell to cycle lows.
The 60-, 120-, 200-, 360-, and 720-day moving averages are particularly important when analyzing Bitcoin. Every time Bitcoin price fell below these MAs, the market saw what some analysts called an “intergenerational buying” opportunity.
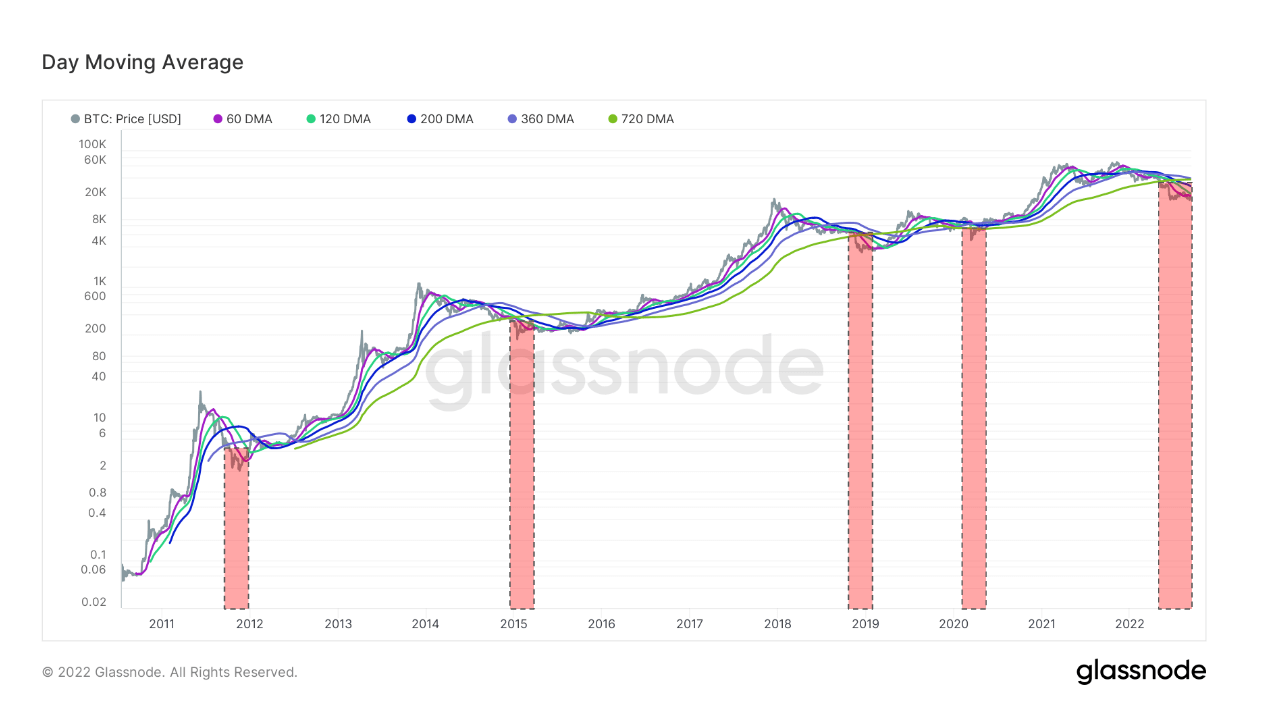
Bitcoin has broken below all major moving averages for the fifth time, according to Glassnode data. Bitcoin’s period below its current moving average is also the longest in history, almost twice as long as the previous declines seen in 2011, 2015, 2019 and the end of 2020.
Moving averages are also some of the other important indicators for determining Bitcoin market cycles. One of those indicators is the Bitcoin Investor Tool created by analysts. Philip SwiftIntended as a tool for long-term investors, the indicator consists of two simple moving averages of the Bitcoin price: a 2-year MA and a 5x 2-year MA.
These moving averages are used as a basis for determining undervalued or overvalued situations in the market. This indicates a period during which price is likely to approach cyclical highs and lows.
Bitcoin price trading below the 2-year MA has historically produced very large returns and marked bear cycle lows. When the price traded above the 2-year moving average x5, it marked the climax of a bullish cycle and a risk-averse zone for long-term investors.
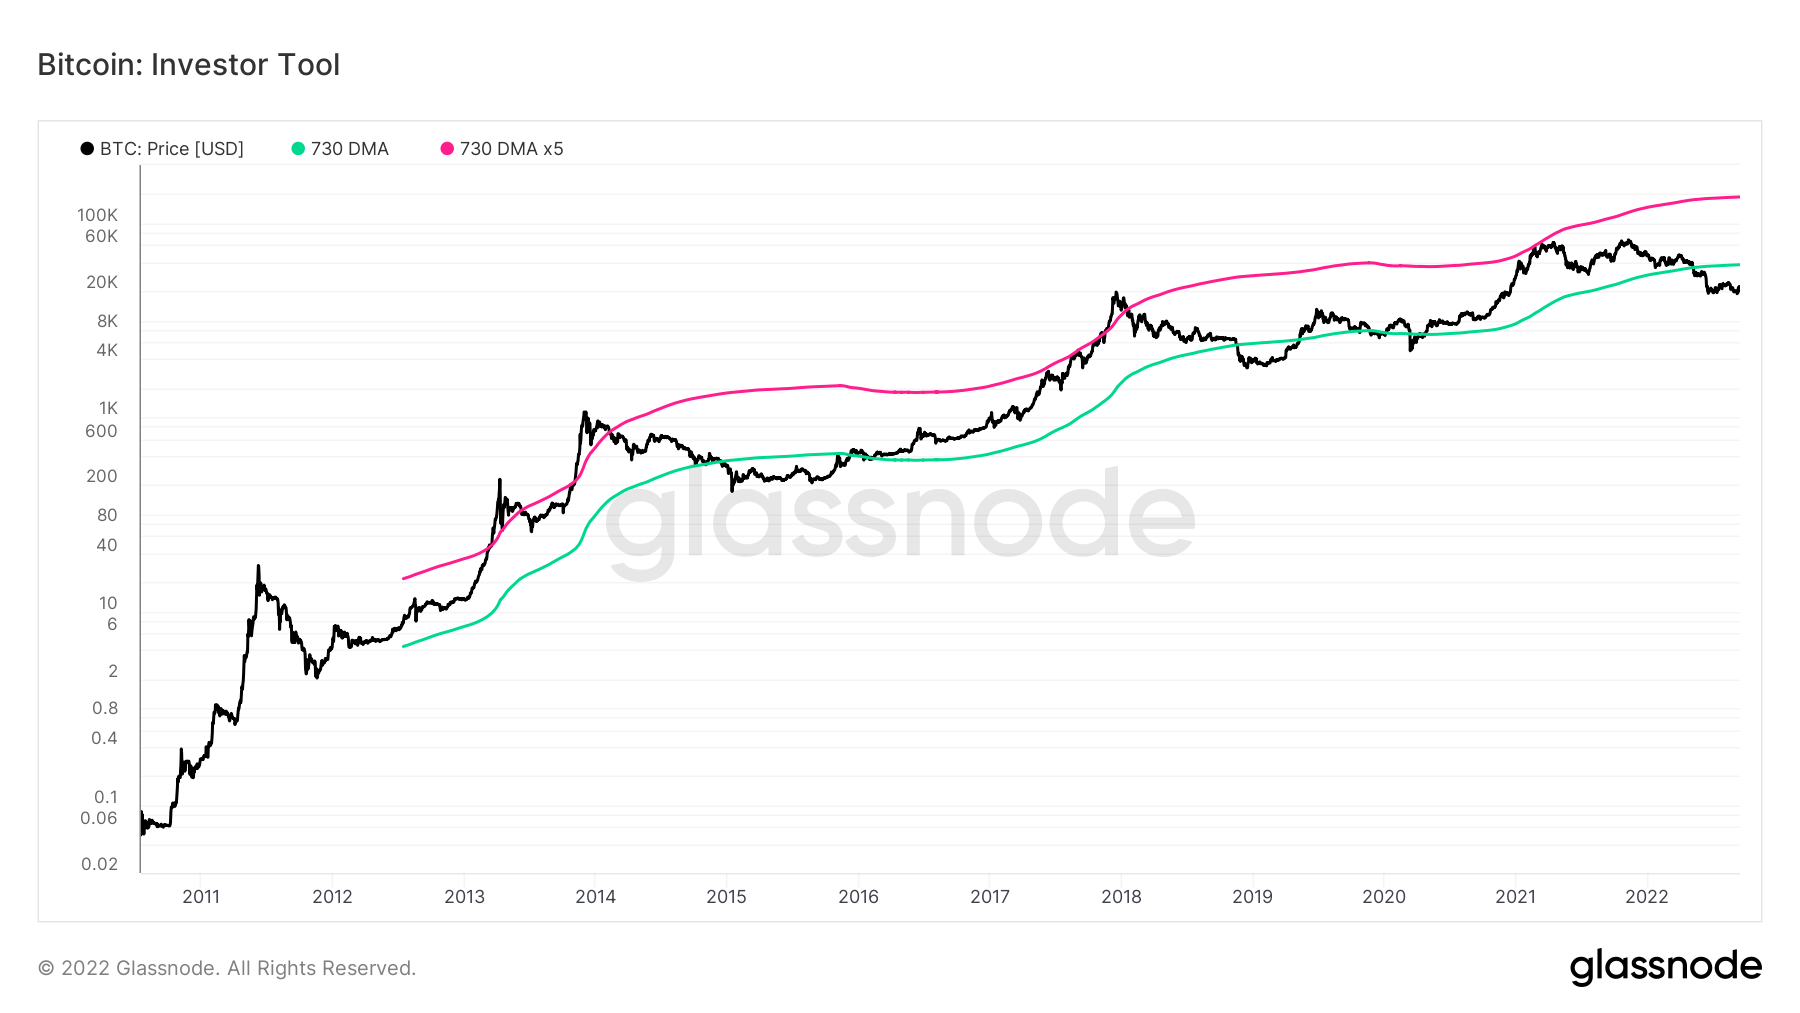
Bitcoin has been trading below its 730-day moving average since Terra (LUNA) crashed in May. Since 2011, BTC has broken below the 730-day moving average line only three times briefly in 2015-16, 2019 and 2020. The decline in March 2020 was measured in days rather than months. Bitcoin’s current stint under the MA has broken this pattern, entering for the fourth month in a row.
Bitcoin has recovered each time below the 730-day moving average. If past patterns repeat themselves, we are set to recover from this decline as well. However, it is still too early to tell how fast that recovery will be. The current crypto market uncertainty is exacerbated by a deteriorating macro environment, making it difficult to predict what the coming winter will bring.


