Ethereum price volatility expected post-Merge as open interest options soar with bearish divergence

The long-awaited Ethereum merge is scheduled for September 15th. This integrates an existing Proof of Work (PoW) execution layer into a concurrently running Proof of Stake (PoS) beacon chain. Proponents hope this will bring scaling and environmental benefits.
Prices rose significantly in the lead-up to the merger, rising 90% after bottoming out on June 18, but buying activity appears to have peaked over the weekend.
An analysis of the ETH derivatives indicator showed that traders expected a price drop to occur after the merger.
volatility smile
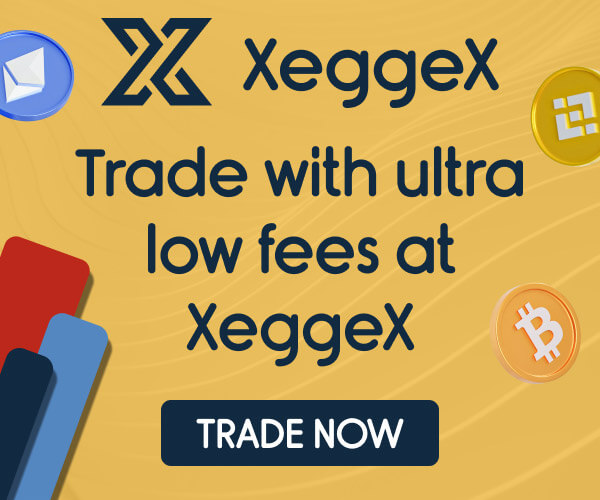
The Volatility Smile chart shows implied volatility by plotting the strike price of an option with the same underlying and expiration date. Implied volatility increases when an option’s underlying is more out of the money (OTM) or in the money (ITM) than at the money (ATM).
Making an option more OTM usually results in higher implied volatility. Therefore, the volatility smile chart usually shows a “smile” shape. The steepness and shape of this smile can be used to assess the relative cost of an option and determine the type of tail risk the market is pricing in.
The attached legends refer to past overlays, showing smile shapes 1 day, 2 days, 1 week, and 2 weeks ago, respectively. For example, if ATM implied volatility values for extreme strikes are lower today compared to historical overlays, it could indicate that the market is pricing less tail risk. there is. In such cases, the market view is that extreme moves are less likely than moderate moves.
In our previous study, a month ago, we used the Smile Volatility chart to explore the behavior of options traders. The overall conclusion was that options traders expected prices to rise, leading to post-merger declines. But what has changed between then and now?
The volatility smiles chart below shows the bearish divergence for each of the historical overlays and current smiles. Generally, the lower the strike price, the lower the implied volatility. However, the left tail of each example is about 100% or more, indicating that the implied volatility can fluctuate after the merger.
Option open interest
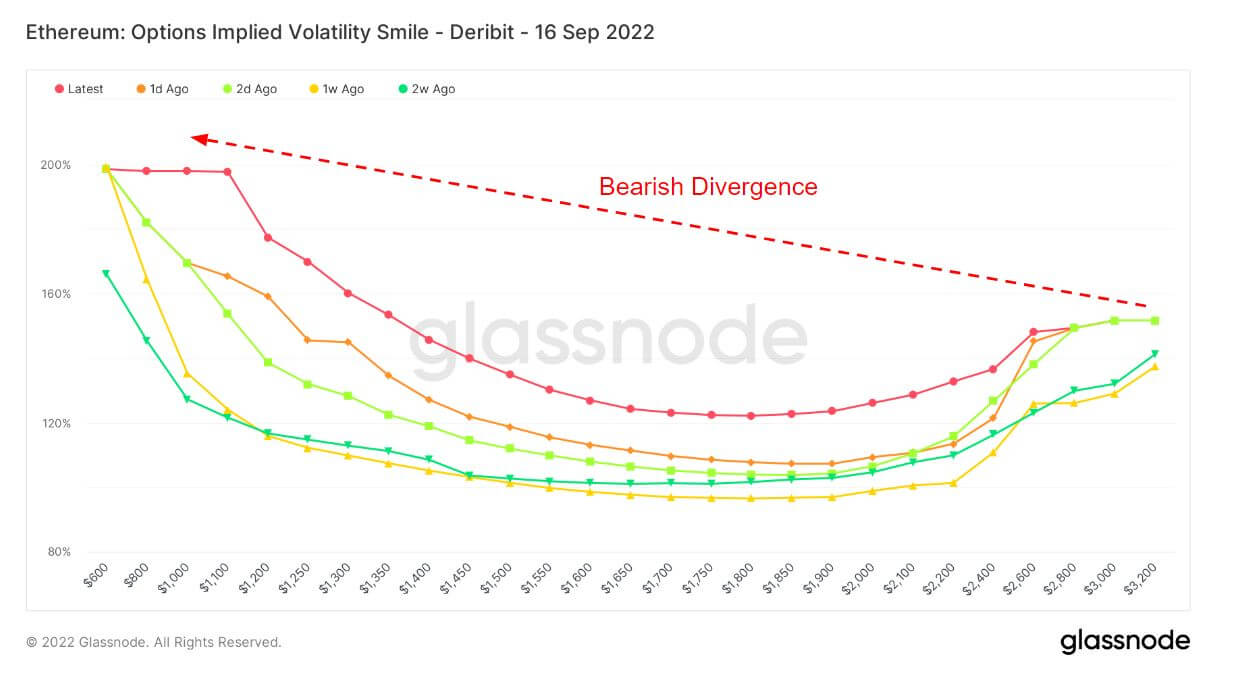
Option open interest refers to the number of active option contracts. These are contracts that have been traded but have not yet been liquidated by an offsetting trade or allocation.
There is no information about when the option was bought or sold. However, this metric can be used to measure volume at different strike prices and determine liquidity.
The chart below shows the total put and call open interest by strike price. A slight bias towards puts (or the right to sell a contract) indicates bearish sentiment. At the same time, the most important data point shows over 22,000 puts at the $1,100 price.
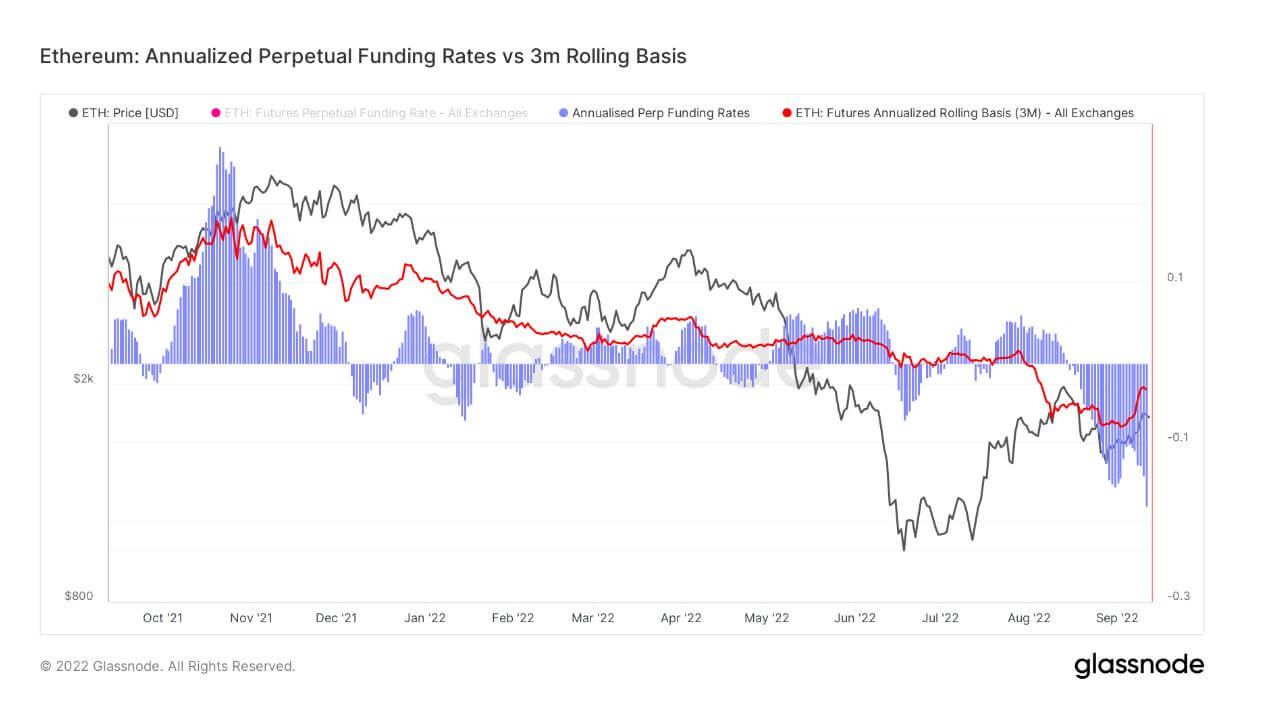
Annualized perpetual funds
This indicator compares the annualized rates of return available in cash and carry trades between 3-month futures (3-month rolling basis) and perpetual funding rates.
Given that digital assets have low storage, handling, and delivery cost overheads (unlike physical commodities), perpetual futures are a great alternative for market speculation, risk hedging, and to capture funding rate premiums. It has become my preferred method.
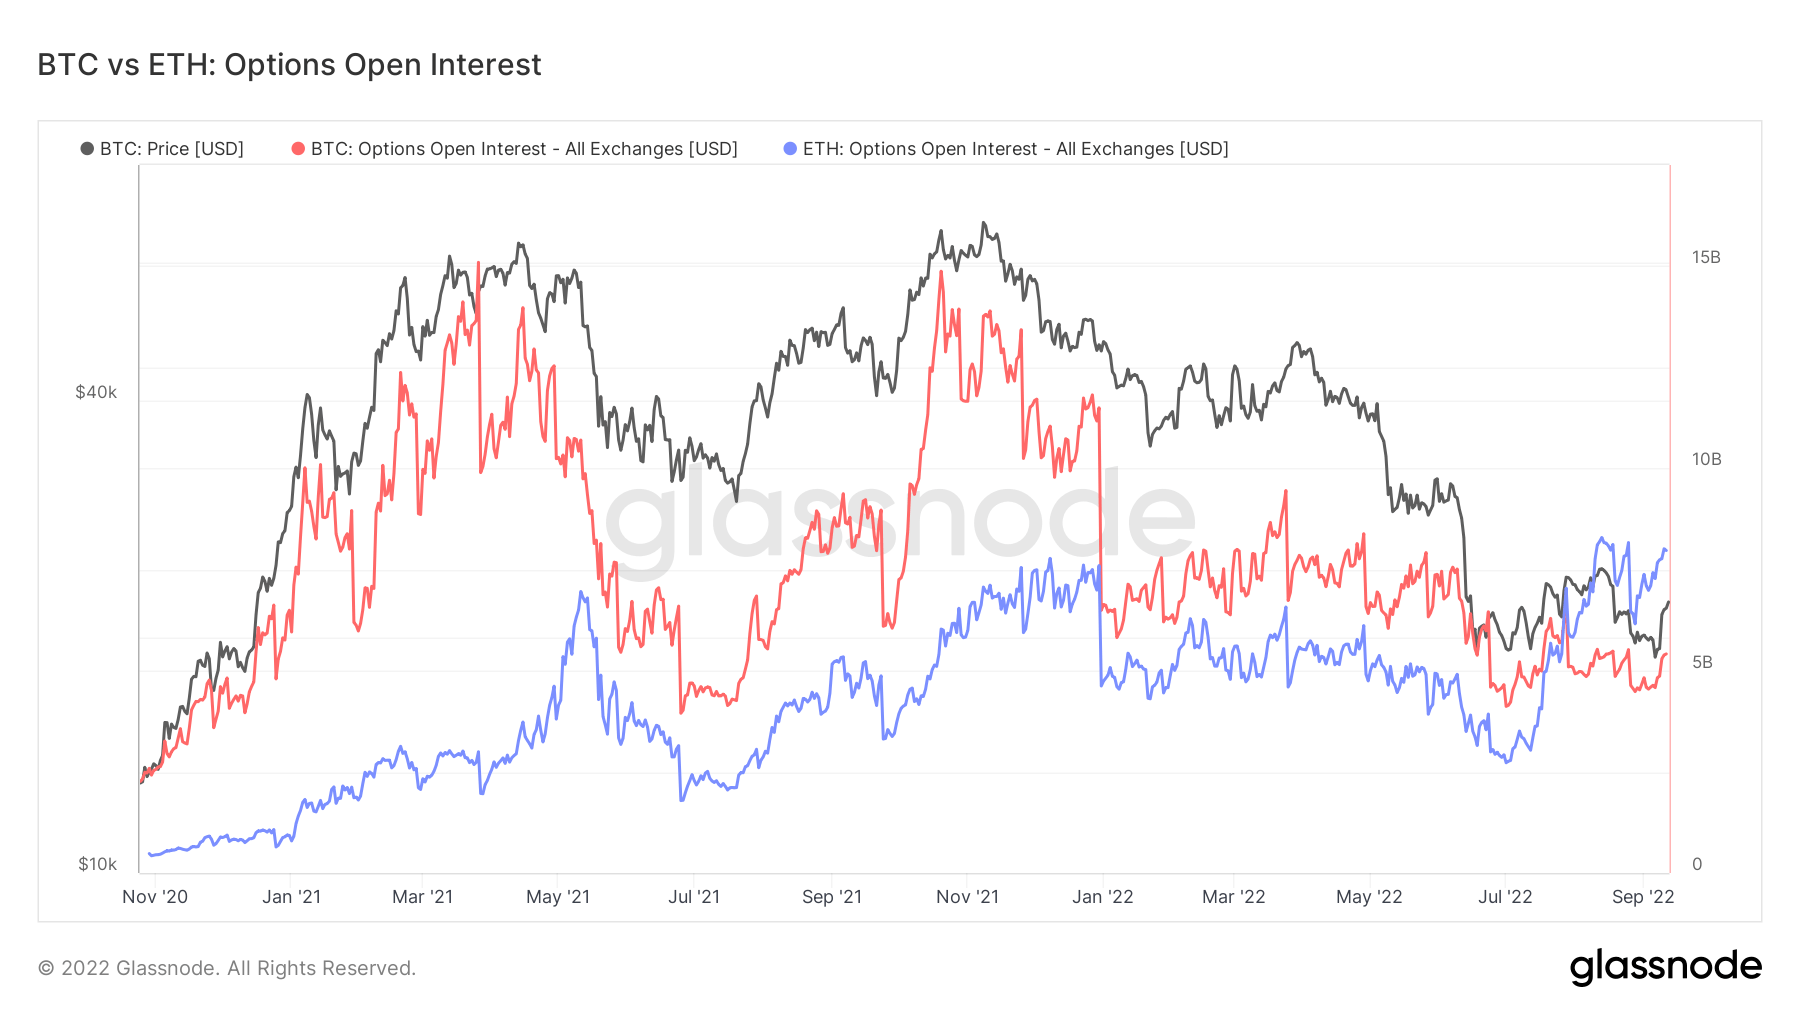
Bitcoin and Ethereum options open interest
Comparing open interest in Bitcoin and Ethereum options, ETH hits a new all-time high at $8 billion. Meanwhile, BTC’s current open interest is around $5 billion, well below its peak of $15 billion.
In July, ETH open interest moved BTC for the first time, indicating strong speculative interest and derivatives traders gearing up for a merger.