Exchange flow metrics are used to assess investor sentiment and behavior. An inflow to an exchange usually means that token holders cash out their profits. Outflows, on the other hand, are usually associated with holders moving their tokens out of exchanges for long-term storage.
Both inflows and outflows have declined significantly from their November 2021 market highs, with inflows plunging to multi-year lows to see the biggest change.
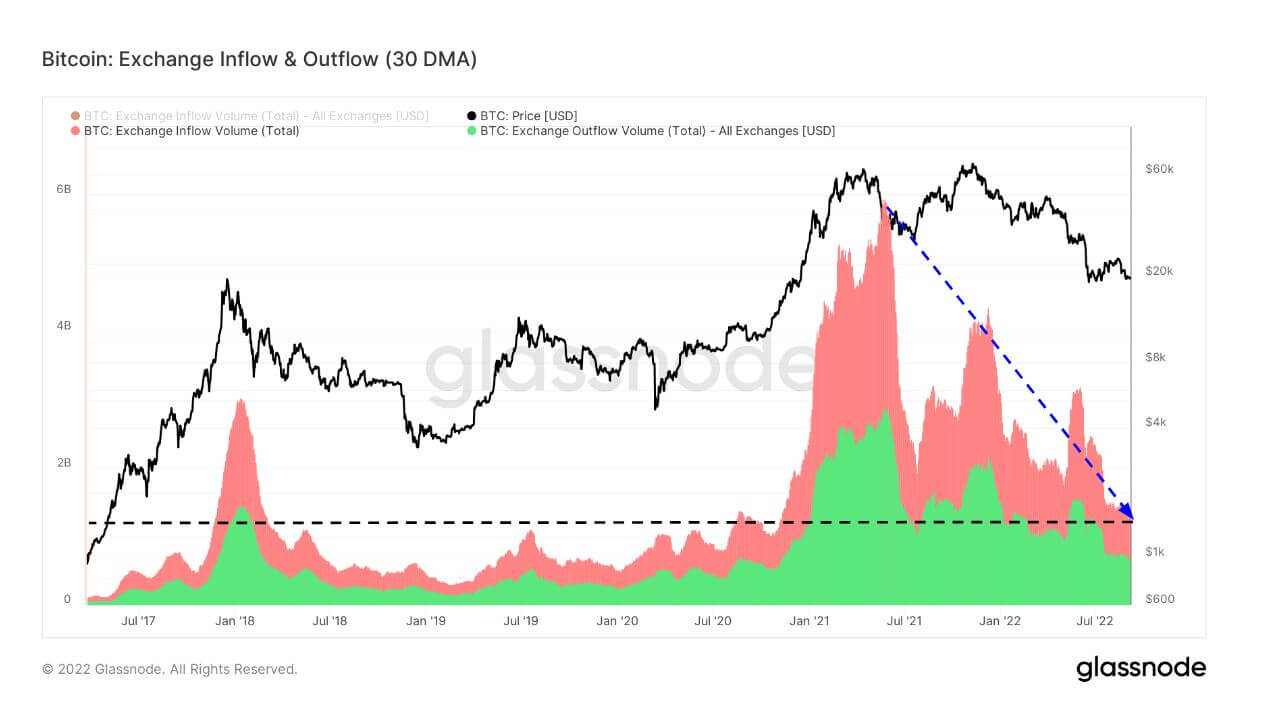
Bitcoin exchange inflows and outflows
Exchange inflows and outflows show the total amount of Bitcoins transferred to and from exchange wallets in USD. The chart below shows that inflows have consistently outpaced outflows on a 30-day moving average since mid-2017. This is expected behavior in a bull cycle as smart money holders send BTC to exchanges to cash out their profits.
The disparity has been particularly pronounced since the market high in November 2020, with inflows significantly outstripping outflows, culminating in a peak of around $6 billion in June 2021.
However, since that peak, inflows have declined significantly, consistent with the COVID-19 crisis levels seen in July 2020.
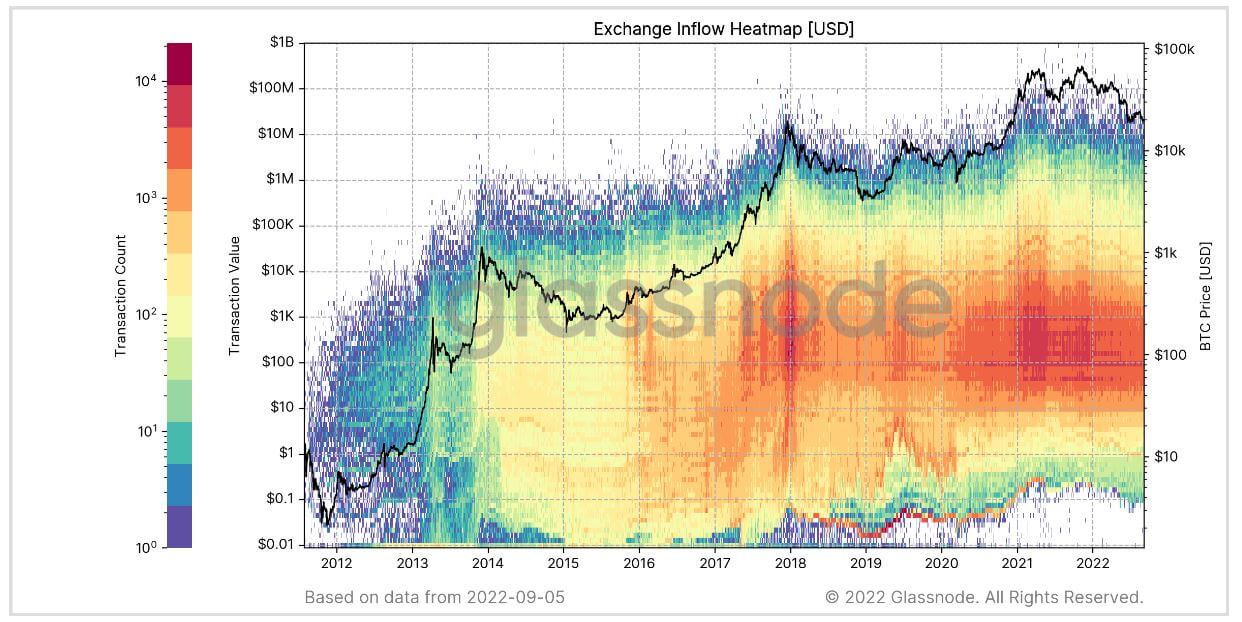
Exchange inflow heat map
Heatmap shows breakdown of total transfer volume sent to When withdrew from exchange in US dollars.
The left y-axis represents the size of individual trading volumes in USD. Color represents the number of transactions in each of the 100 volume buckets. At the same time, the right y-axis shows the price of Bitcoin in USD on a logarithmic scale. The bottom x-axis is time.
The chart below shows the massive inflows that occurred during the last bull market peak in December 2017. Similarly, this pattern also emerged during Bitcoin’s double top in March 2021 and November 2021, when the price of Bitcoin reached $64,000 and $69,000 respectively.
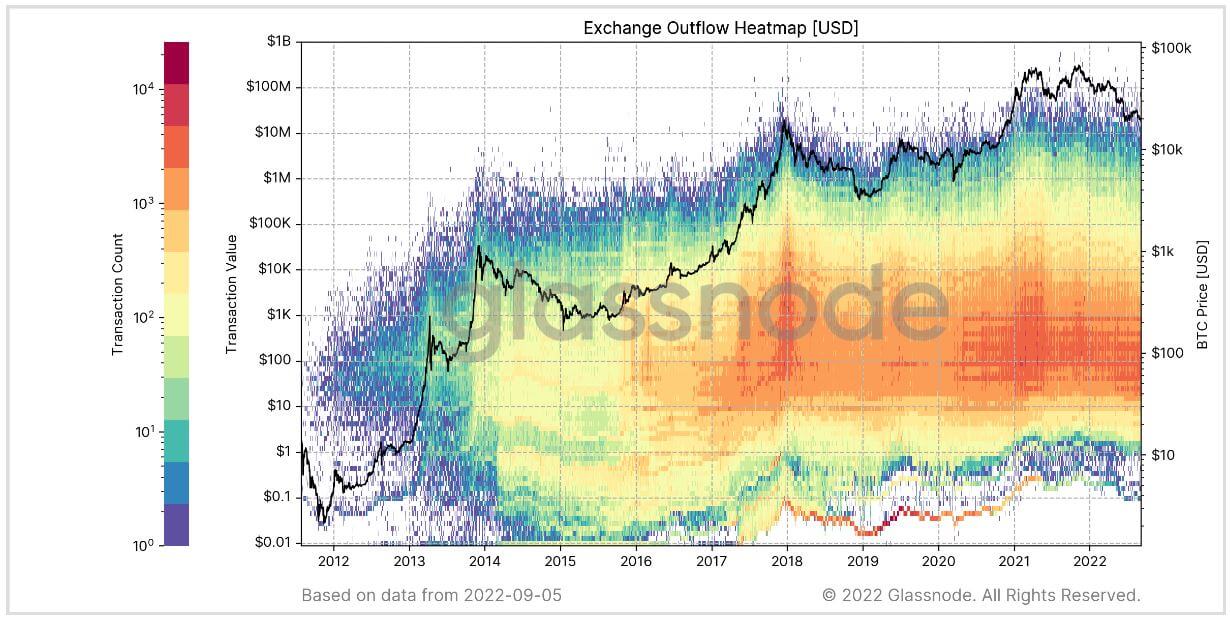
Exchange Outflow Heatmap
Token outflows follow a similar pattern as inflows, with transaction peaks occurring in December 2017, March 2021, and November 2021.
Combined with previous observations, it suggests that short-term holders bought BTC heavily during the peaks of both bull cycles, while long-term holders sold at the highest prices.