This on-chain ratio shows Bitcoin could go lower before final capitulation


One of the most frequently used on-chain indicators to determine Bitcoin performance is long-term holder behavior. Long-term holders, defined as addresses that have not moved BTC for 6-12 months, often represent the tops and bottoms of the market.
The Short/Long-Term Realized Value (SLRV) ratio examines the behavioral differences between short-term and long-term holders to detect bear markets. The SLRV ratio is the percentage of Bitcoin supply that was last moved within 24 hours divided by the percentage that was last moved 6 to 12 months ago.
A high SLRV ratio indicates that short-term holders are more active on the network and can often indicate a hype cycle or market top approaching. A low SLRV ratio indicates little short-term holder activity or a significant increase in the long-term holder base.
The ratio was created by capriol investmentcryptocurrency investment funds, identifying market transitions between risk-on and risk-off allocations to Bitcoin.
According to the SLRV ratio, Bitcoin is currently in the pink zone, where it has been since bottoming out at $17,600 in June of this year. The pink zone shows his SLRV ratio below his 0.04, historically consistent with previous bear market accumulation zones.
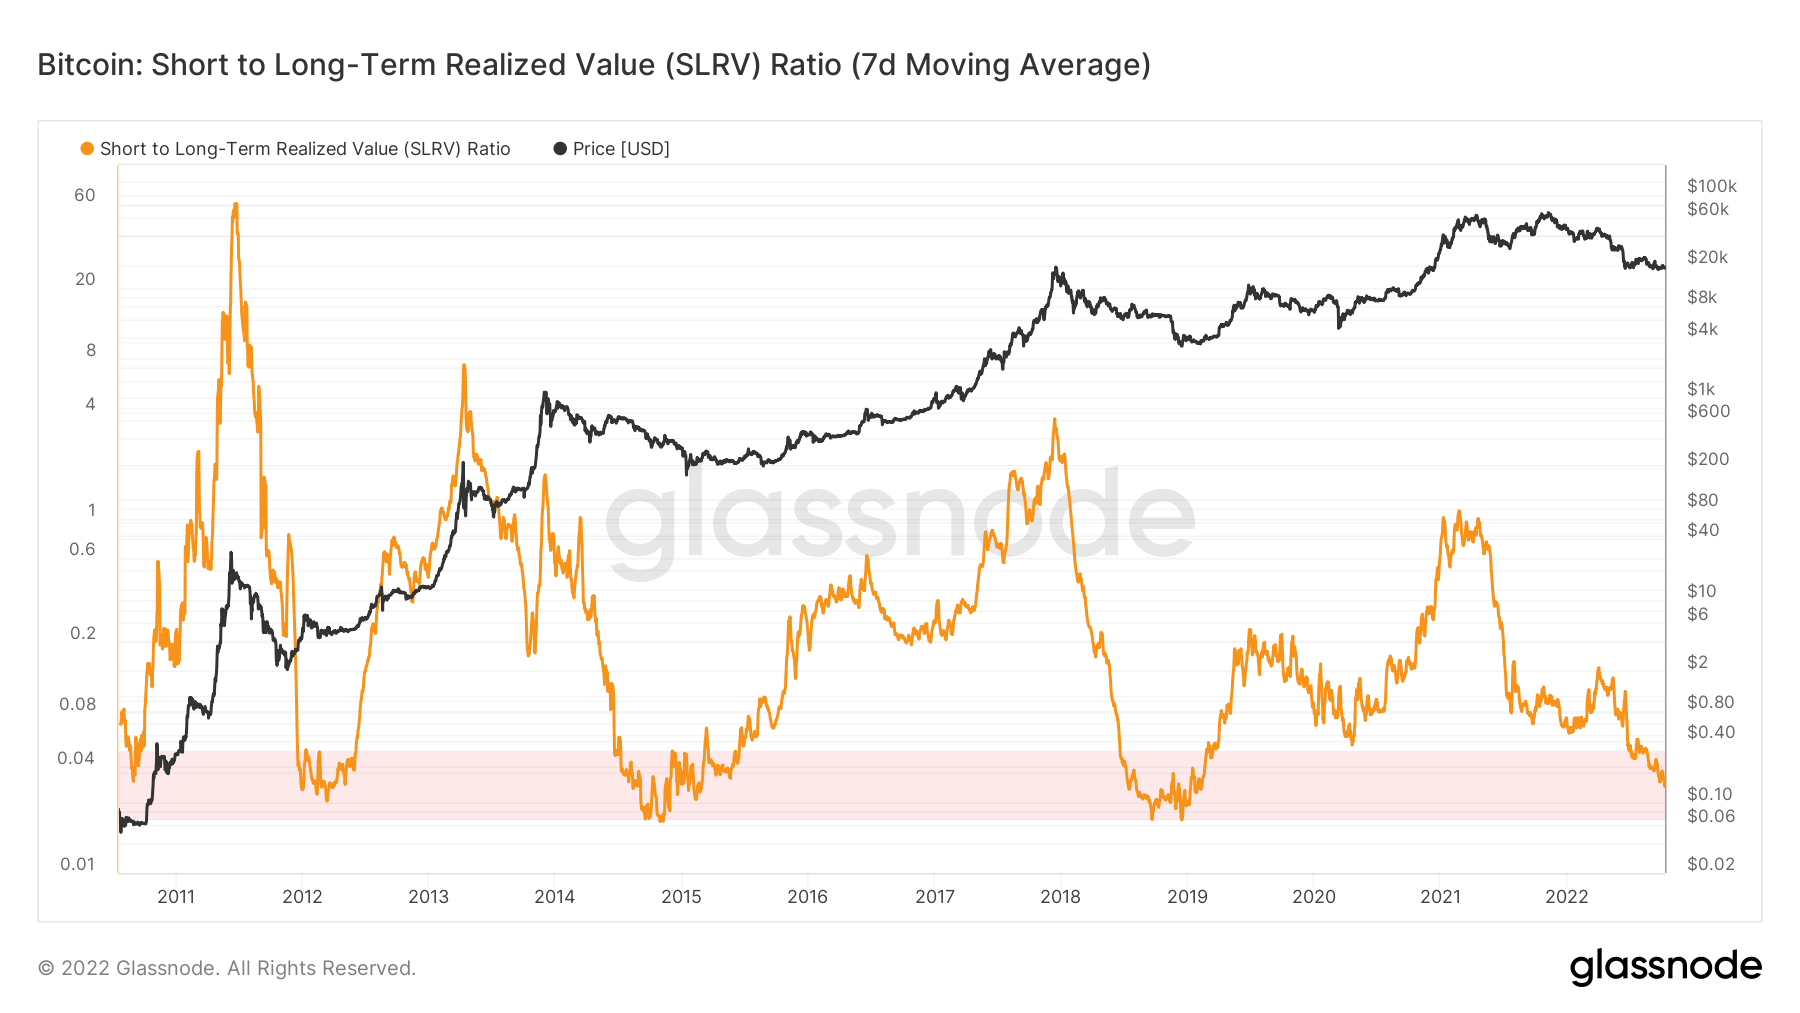
In every bear market so far, Bitcoin has hit a solid bottom in the pink zone, marking the final price drop before a rebound. however, glass node It shows that BTC has yet to hit the bottom of the pink zone.
Digging deeper into the SLRV ratio, we can see that Bitcoin is making lower highs with each bull run. This could mean that Bitcoin may experience less intense bull and bear drawdowns in the future, with less volatility in between. Besides bringing relief to long-term investors, a less volatile market could also increase institutional adoption.
To solve some problems with SLRV ratios, Capriole Investments created the SLRV ribbon. The SLRV Ribbon is an investment strategy that applies short-term and long-term moving averages to his SLRV ratio to mark the transition from risk-on to risk-off markets.
The SLRV ribbon consists of a 30-day moving average and a 150-day moving average. The 30-day moving average above his 150-day moving average suggests that the market is exiting a period dominated by long-term holder activity.
The periods in which long-term holders show the most activity are often associated with accumulation zones. This is the price floor that LTH uses to increase her BTC holdings. Short-term holder activity tends to increase in the later stages of these accumulation zones, marking the beginning of a new adoption cycle and the beginning of a market rebound.
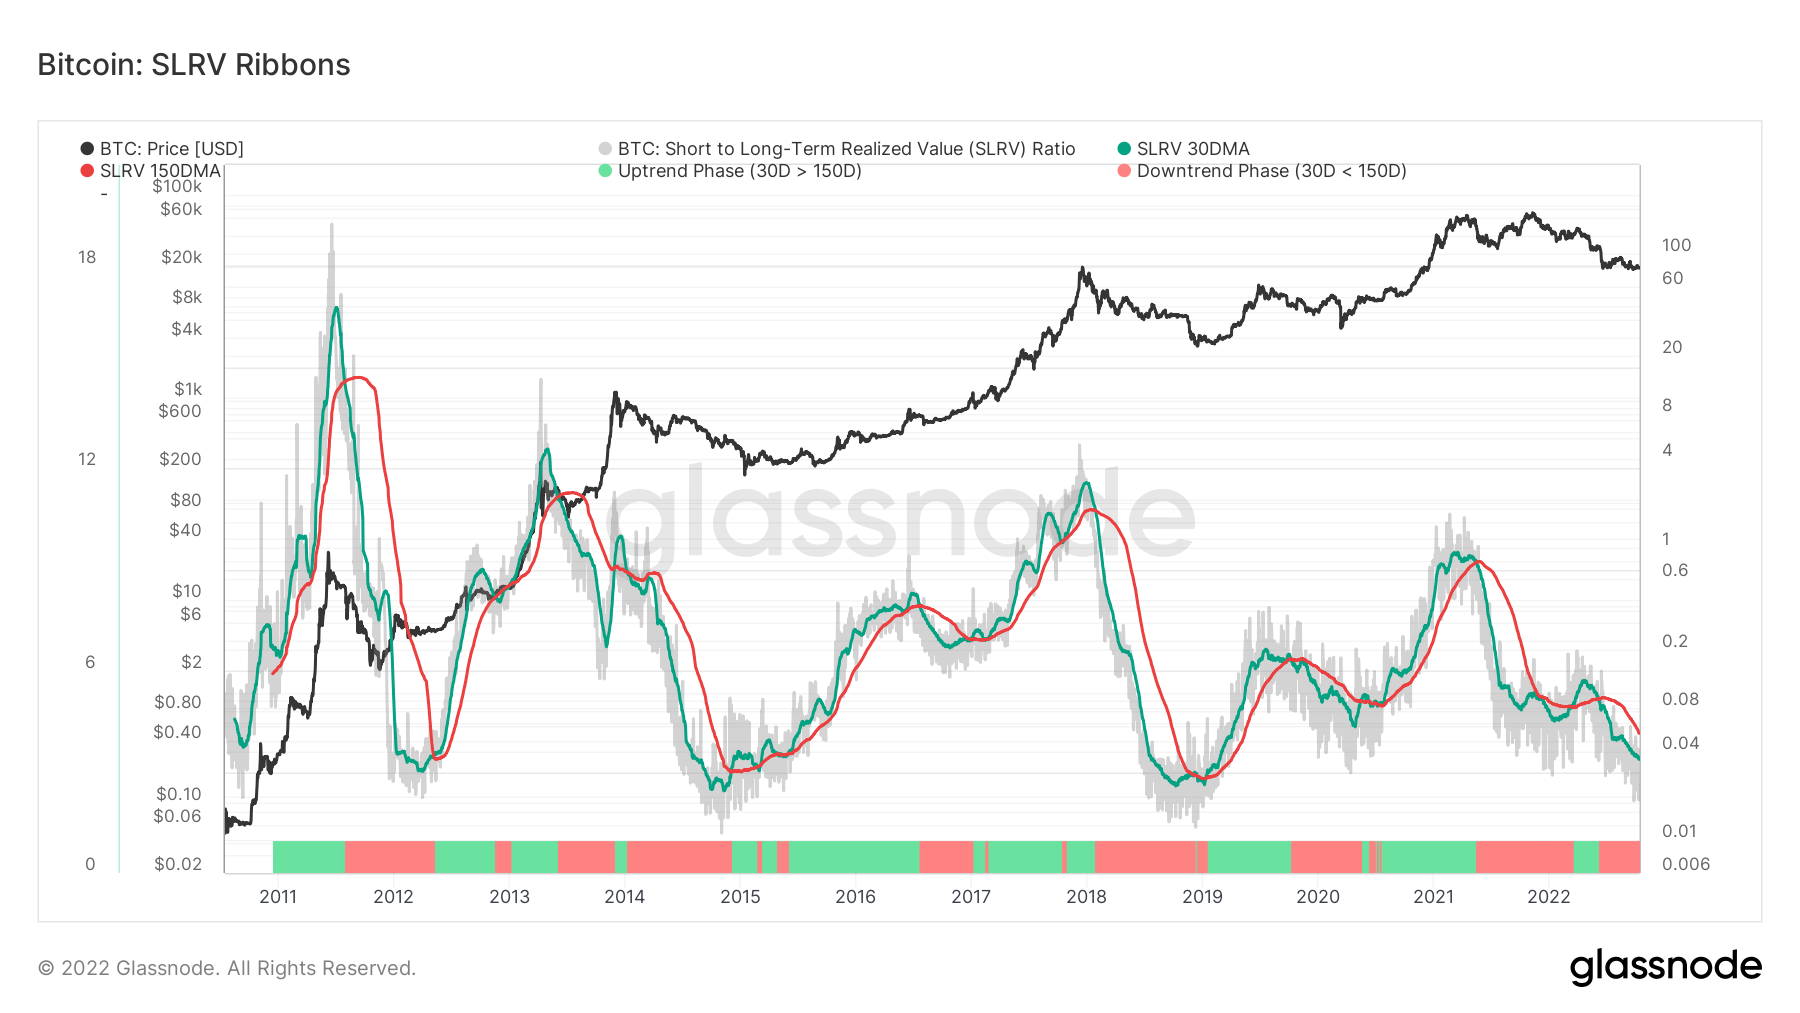
The SLRV ribbon shows that the market has largely been in a risk-off state since China banned Bitcoin mining in May 2021. Recovery in 2022, but no signs of reversal so far.
The lack of a trend reversal further reinforces the data presented by the SLRV ratio — Bitcoin could fall further before hitting the bottom.