
Over the past month, bitcoin’s price has been eclipsed by major macro events, including the recent SEC lawsuits against Coinbase and Binance, which have alleged multiple securities breaches and contain language that could reshape the industry. It has changed with each regulatory announcement.
These events only added to the volatility and, while bitcoin’s price volatility was not as violent as it could have been, it created market turmoil and uncertainty.
Nevertheless, this does not prevent long-term holders from saving.
diamond hands forever
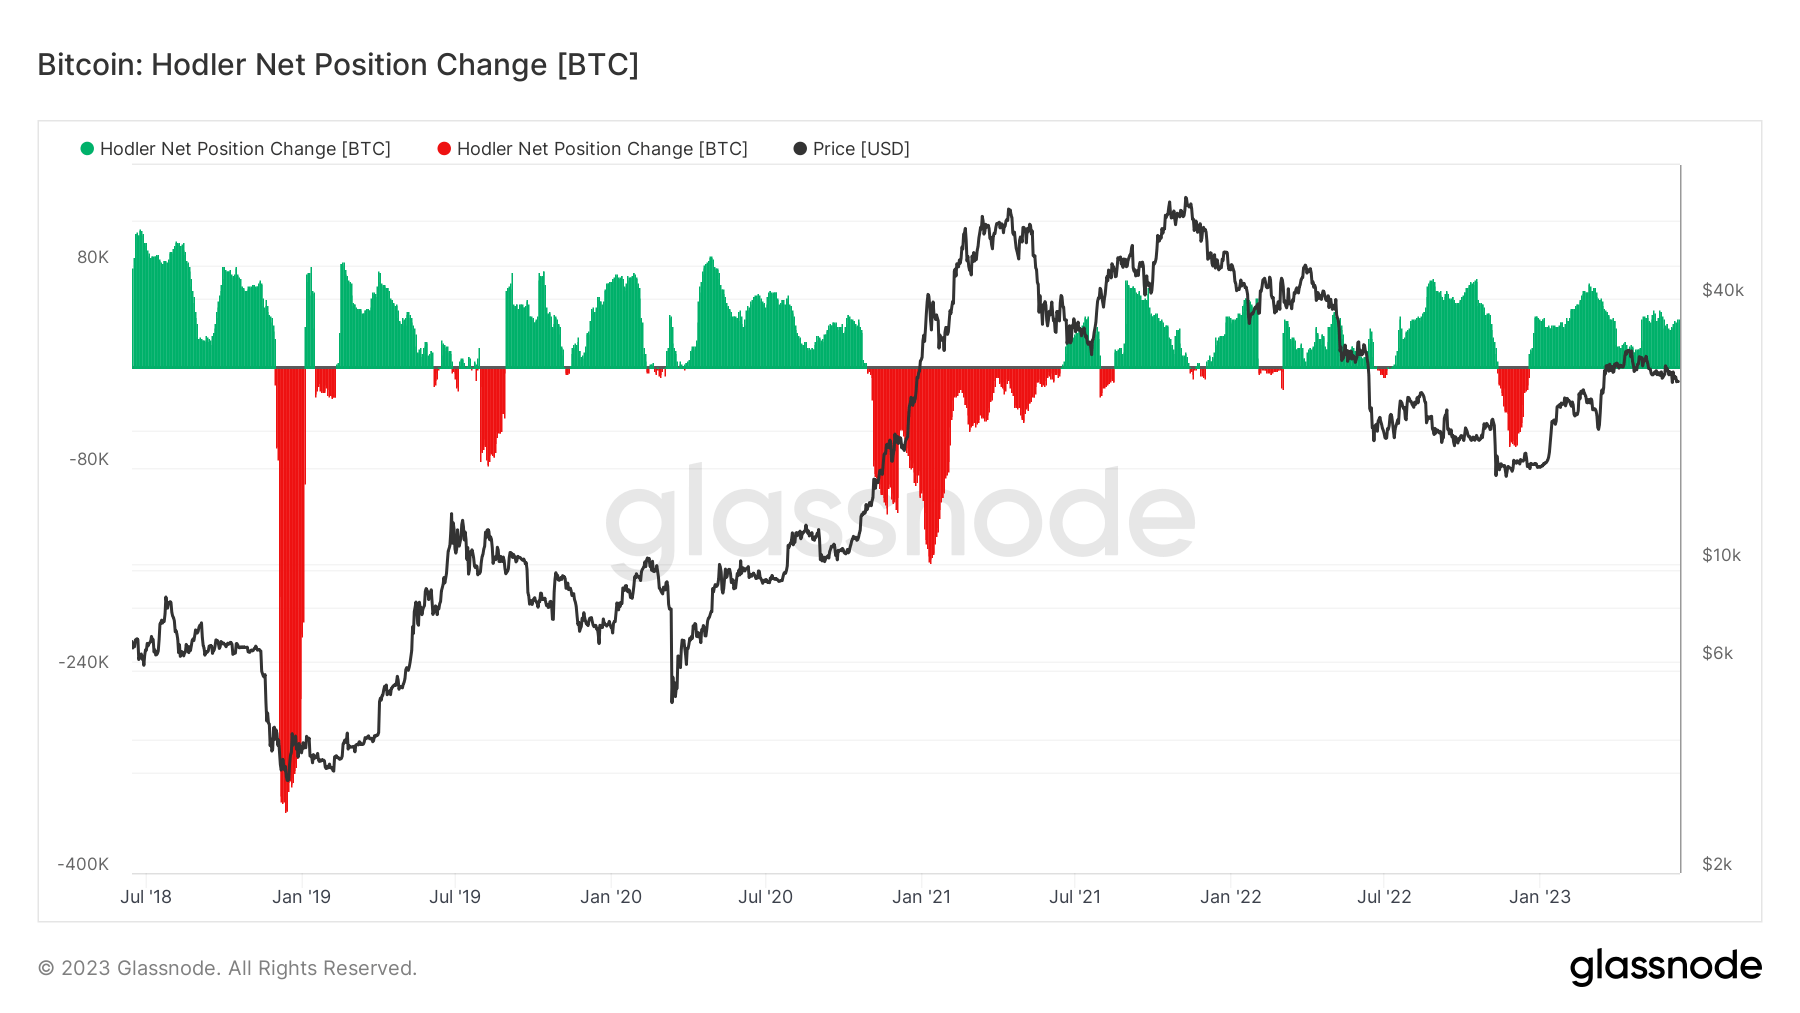
Long-term holders are addresses that have held their coins for at least 155 days without moving them, demonstrating a more patient long-term investment approach to Bitcoin. Therefore, it serves as an important indicator of market sentiment as it is less susceptible to short-term market fluctuations.
Despite continued market uncertainty, holders continue to accumulate Bitcoin. Glassnode data shows that the holder has been increasing his BTC position since the beginning of the year, with positive changes in position every day.
A marked surge in accumulation was observed in early May, triggering a new wave of accumulation. As of June 12th, Hodler was increasing his position at a pace of 39,233 BTC per month.
Historically, net changes in hodler positions have been inversely correlated with Bitcoin price movements, with long-term hodlers reducing their positions when Bitcoin price peaks. This shows that experienced market participants tend to buy more Bitcoin when prices are low and sell when prices rise.
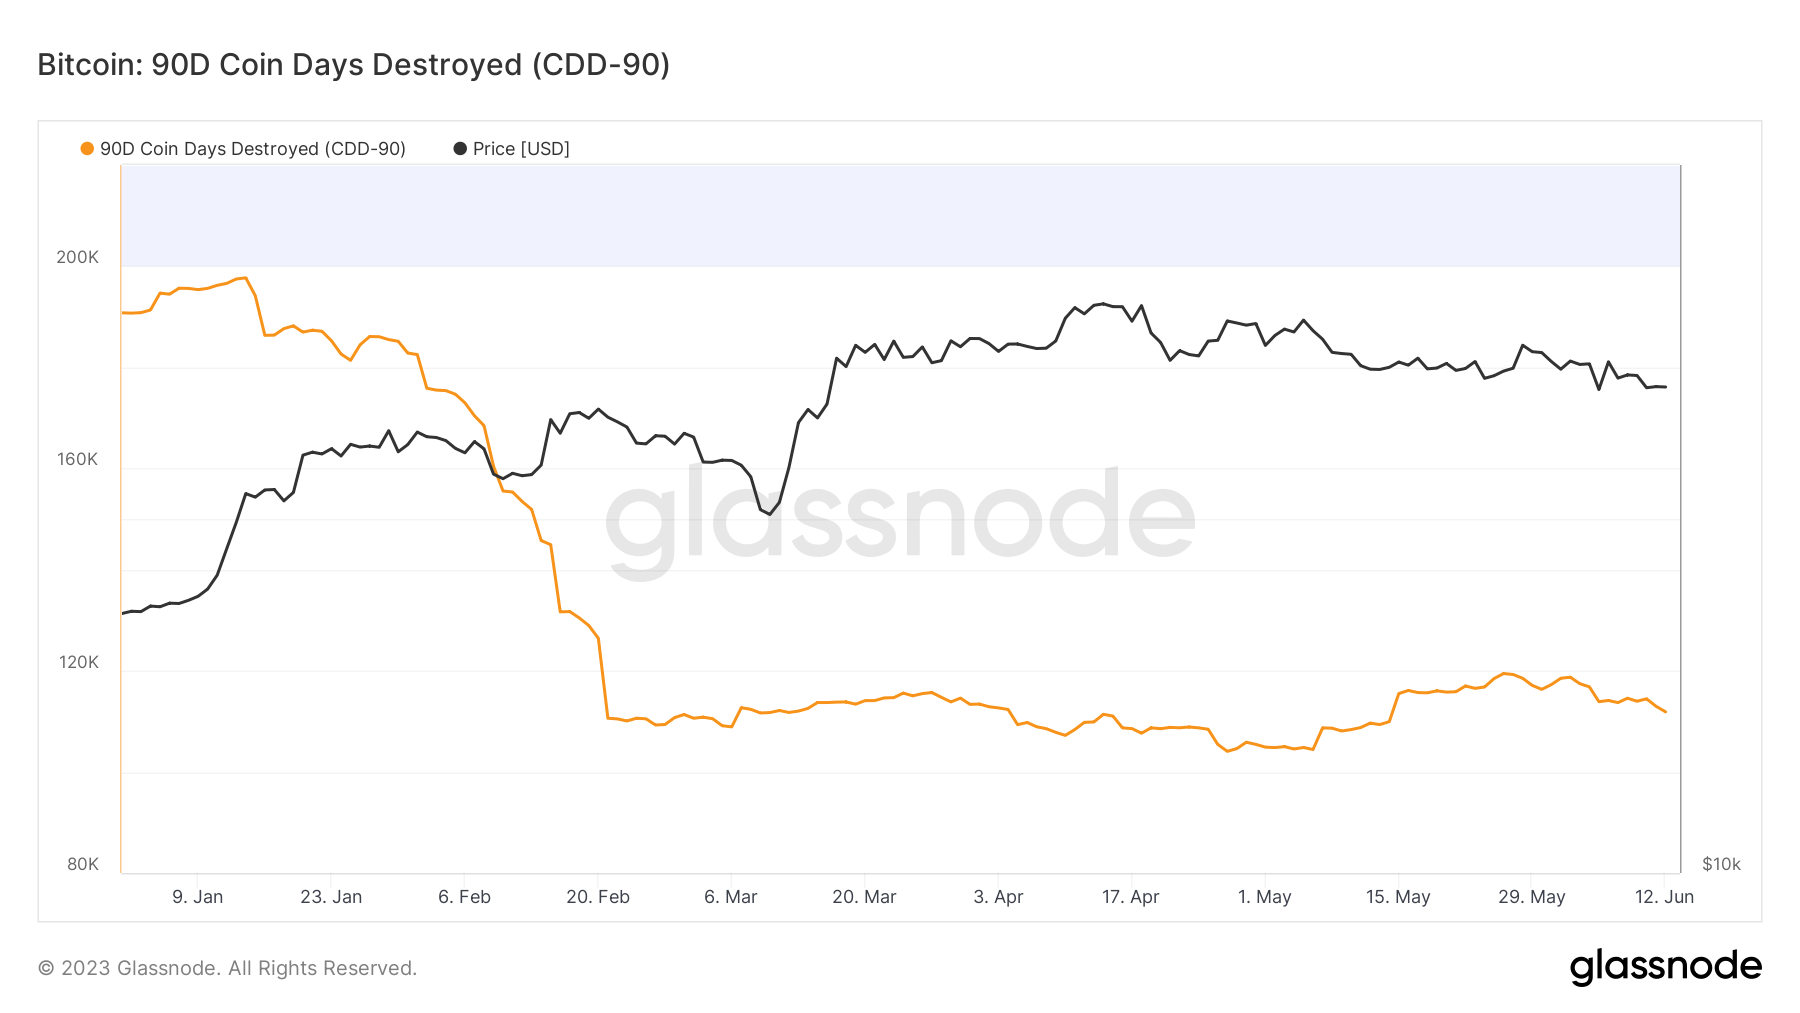
Another on-chain metric, Coin Days Destroyed 90 (CDD-90), further confirms this accumulation trend.
Coin Days Destroyed is a method of measuring the movement of old coins. Holding one bitcoin for a day creates a coin day, and moving a bitcoin destroys a coin day. CDD tracks the total age of all Bitcoins moved on a given day, providing insight into whether the number of older coins held by long-term holders has moved.
CDD gives a solid overview of the condition of older coins, but CDD-90 is a more relevant measure. This metric aggregates all CDDs over the last 90 days and provides a better insight into Bitcoin’s economic activity over a longer period of time. An upward trend in the CDD indicates that holders of long-lived coins are selling, while a downward trend indicates declining interest.
Since February 21st, CDD-90 has been moving sideways. This suggests Hodler is spending less and increasing his Bitcoin position. This buildup reduces the amount of Bitcoin available on the market and tightens the supply.
Long-term hodler accumulation and CDD-90 flat trend suggest continued interest in Bitcoin despite market uncertainty. Bitcoin’s near-term future remains uncertain given the complexity of macro and intra-industry factors, but these indicators signal a quiet but firm confidence in the asset.
An article about Hodlers continuing to accumulate bitcoin amid US regulatory onslaught first appeared on CryptoSlate.


