
As markets run deficits and inflation begins to spike, both regulators and consumers turn to the CPI as a measure of the damage caused by high prices, but in the ensuing turmoil as markets plunge into recession, One metric always seems to be overlooked — the M2 money supply.
M2 is a measure of the money supply in an economy that includes cash and current accounts, savings deposits, money market securities, and various other term deposits. Assets contained in M2 are less liquid than M1, which contains only cash and checking accounts, but are typically liquid and readily convertible to cash.
Central banks use M2 to shape monetary policy when inflation hits, making it one of the most important indicators when the economy starts to slow.
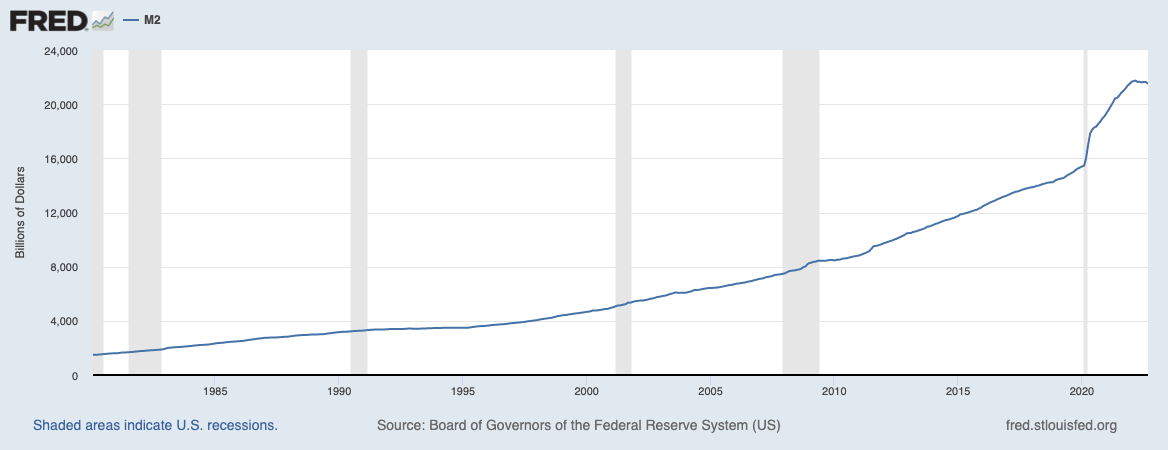
Look at the data US Federal Reserve data show that M2 has grown exponentially since 1980. Recession periods have historically accelerated M2 growth as the Fed’s quantitative easing approach increased the money supply to the economy.
This is evident in the Fed’s data. The gray area in the graph below indicates periods of recession, showing an increase in M2.
Many economists consider M2 to be a much better indicator of inflation than the CPI. The coveted Consumer Price Index tracks the average increase across baskets of consumer products and is used to estimate the average increase in prices experienced by consumers.
However, CPIs tend to show average increases and much lower price increases than consumers actually experience.
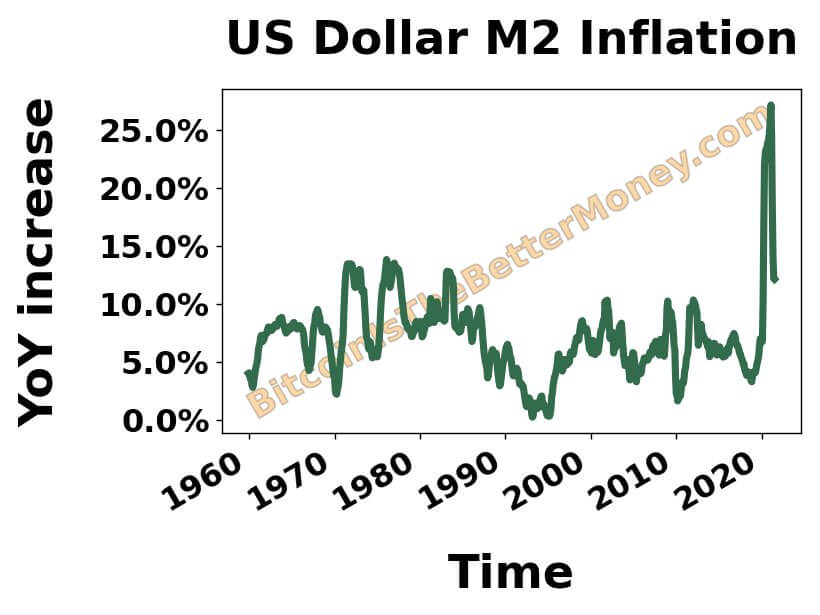
According to the latest figures, the CPI increase is about 8%. However, consumers feel he has seen price increases of well over 8%. Looking at the increase in M2 gives us a more realistic view of the price increase.
M2’s year-over-year growth is now over 25%, which feels more in line with consumer experience.
An increase in the M2 money supply is not only an indicator of inflation, but also a solid indicator of Bitcoin’s performance.
Global M2 plays an important role in Bitcoin price volatility. If it shrinks, the price of Bitcoin will fall. As M2 rises, so does the price of Bitcoin.
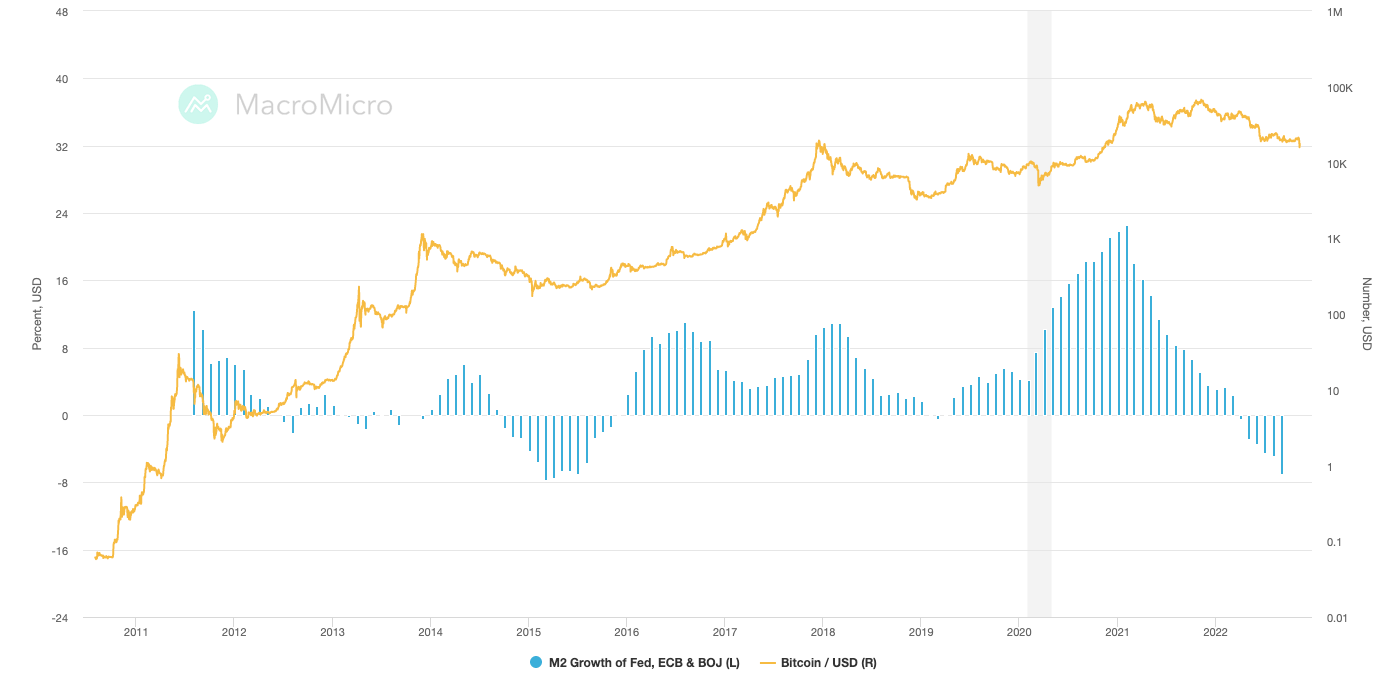
Look at the data The Federal Reserve, European Central Bank (ECB), and Bank of Japan (BOJ) show correlations between M2 and Bitcoin performance. Every time the global M2 grew, the price of Bitcoin made a parabolic move, triggering a bull market. Each time it declined, Bitcoin experienced a slump that led to a bear market.
In 2015, 2019 and 2022, the Federal Reserve embarked on aggressive quantitative tightening. In each of these years, Bitcoin’s price has hit rock bottom.
It is still too early to predict how Bitcoin will react in this quantitative tightening cycle. The current M2 money supply in the US is around $21.5 trillion and has been declining slightly since he peaked at $21.7 trillion in March this year.
M2 declines correlate with Bitcoin price declines. If the downtrend continues, Bitcoin’s price may fail to recover and recapture yearly highs. But for the current US credit-based economy to remain a credit-based economy, the supply of US dollars must continue to increase. In the long run, an endless cycle of printing money could be good for Bitcoin.


